« August 2007 | Main | October 2007 »

September 2007

September 30, 2007

Optimizing "Red Ocean" Expenses

In 2006 Microsoft (NASDAQ: MSFT) spent $21.9 billion on the execution of its "red ocean" strategy. What did shareholders get for their money?

This is the second in a series on "Microsoft's $154 Billion Question" and the 7th in a series on corporate brands in enterprise marketing. In this post I map enterprise marketing expenses onto the sources of intangible market value and introduce a simple measure of how shareholders know if they're are getting their money's worth on "red ocean" spending.

BRAND NAMES IN ENTERPRISE MARKETING
Corporate brand names play a much more significant role in enterprise marketing than they do in micromarketing. In fact, much of my book "Competing for Customers and Capital" is dedicated to highlighting the larger role of corporate brands and providing directions on how to deal with it. As with the other posts in this series the analysis is based on real-world, real-time examples using published financial data.

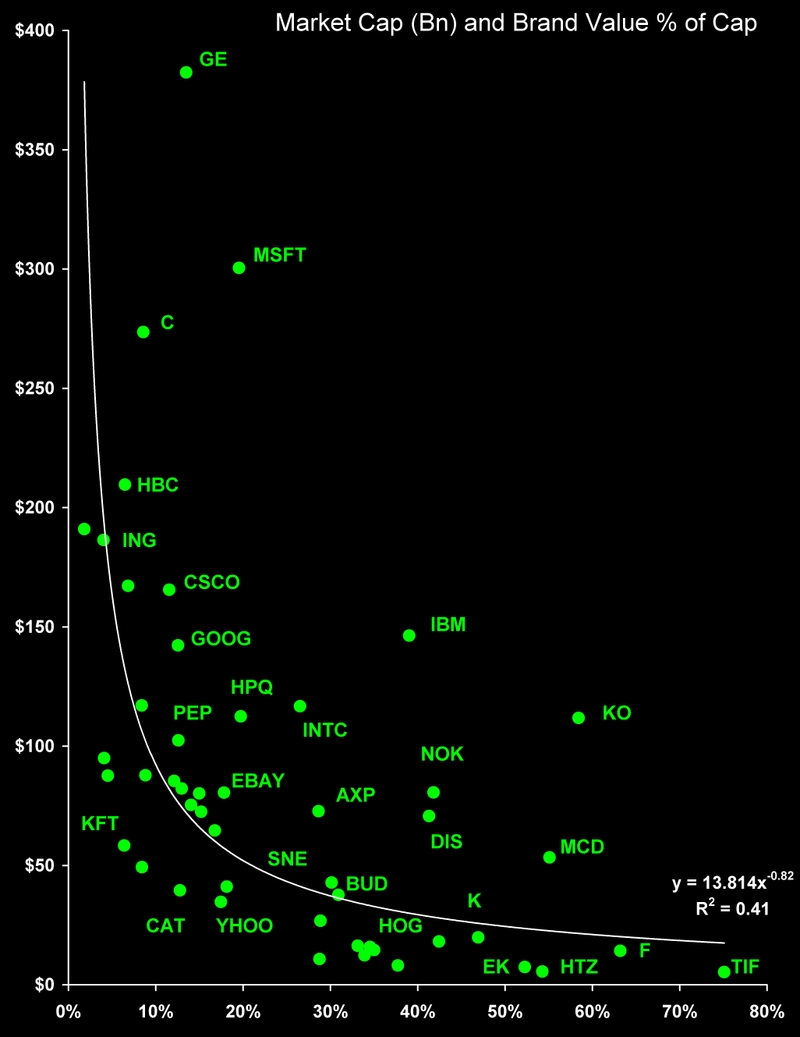
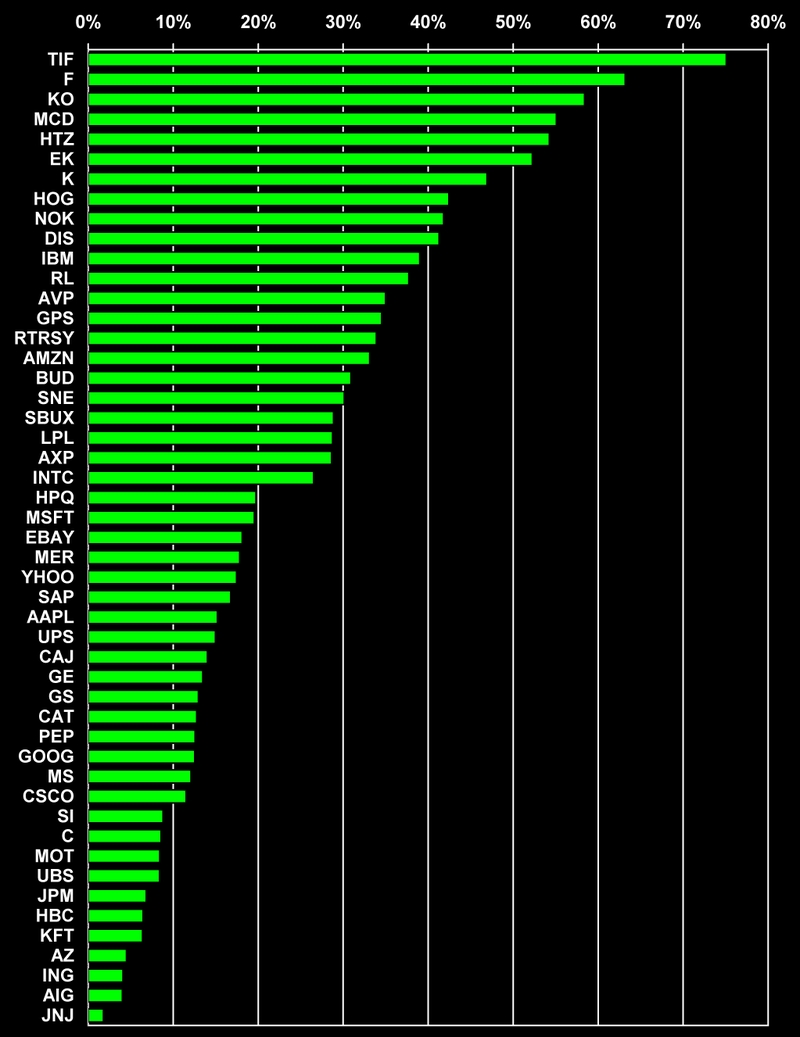
The 1st post in the series was "Sears Brand Bonds," which took a look at how Edward Lampert captured the difference between the book value and the market value of the Sears brand name by issuing brand bonds. The 2nd post applied these ideas to "Coca-Cola's Brand Bonds" to illustrate how the company might create new market value for its 200 lesser known brand names and, at the same time, resolve the ongoing battle with its bottlers. The 3rd post took a marketing oriented look at how to create value by co-branding a company's trademark and ticker symbol in Put a Little LUV in Your Logo!. The 4th one on "Brand Value vs. Book Value" was a broad-brush view of the difference between Interbrand values and book values of 49 of the most valuable brands on the planet. My 5th post in the series took this broad-brush analysis a step further by examining the "Interbrand Value vs. Market Cap" of the same 49 most valuable brand names. The 6th post Accounting for The Unaccountable gave a panoramic view of how all three measures of the value of a company's assets can miss a huge chunk of its market value.

THE DOMAINS OF EXECUTIVE ACTION
Like every other company, Microsoft's revenue dollars may be divided into three parts. I call these Red, White and Blue dollars because they represent three distinct Domains of Executive Action:

• Enterprise Marketing (Red $)
• Corporate Finance (White $)
• Operations Management (Blue $).

The red (enterprise marketing) dollars include all the expenses that drive sales revenue. Some of these expenses enhance revenues by retaining large numbers of existing customers while attracting new ones to the corporate brand. Others diminish revenues by chasing large numbers of existing and new customers away . It's critical to distinguish between the two outcomes. Think of the "Red Ocean Strategy" when you think enterprise marketing expenses.

The white (Corporate Finance) dollars are the earnings left over at the end of each sales cycle. This residual provides corporate financial officers with the discretionary dollars necessary to enhance enterprise value.

The blue (Operations Management) dollars are what it costs to create the product or service before it can be sold. The decisions of managers in this domain set the stage for a company's performance throughout the sales cycle. If they produce a consistently higher quality product or service with larger gross margins than substitutes, the company takes the high ground. Think "Blue Ocean Strategy" when you think of operations management. And remember, Kim and Mauborgne conclude that:

... large R&D budgets are not the key to creating new market space. The key is making the right strategic moves. ... The creation of blue oceans, in other words, is a product of strategy and as such is very much a product of managerial action, not the size or age of the firm (page 5).

A TRIP TO PHILLY
Several years ago a friend of mine was planning a business trip from New Orleans to Philadelphia.  Price wasn’t a factor since the company was paying his expenses.  Otherwise he might have flown on Southwest Airlines (NYSE: LUV).  He decided to book a U.S. Airways (NYSE: LCC) nonstop flight with an upgrade to first class using his Dividend Miles.  He went to the website and got the phone number for frequent flyer services because he couldn’t find his account number or password. And he couldn’t remember how many miles he had in his account either.

After punching through several levels of voice screening he waited five minutes listening to recorded messages about how important his call was.  He finally got a service rep on the line.  He asked her if she would please give him his number and password so he could book an upgrade. Here's the rest of their phone conversation:

“I’m sorry sir we don’t have that information here.”
“What do you mean, isn’t this Dividend Miles?”
“Yes sir, it is.  But we don’t keep that information here.”
“Well, where can I get it?”
“You have to call another number, sir.”
“May I have the number?”
“Sir, I don’t have that number here.”
“You don't have that number? This is Dividend Miles for Pete’s sake!”
“Sir, I don’t have that number here.”
“Ok, will you just tell how many miles I have in my account?”
“No sir, I can’t give out that information without an account number.”
“Never mind, I think I won’t fly U.S. Air ever again.”

It turns out he had to fly U.S. Airways anyway because it had the only nonstop flight that arrived in Philly at 2 p.m. in time for his 3:00 meeting. It was the same price as the nonstop Southwest flight.  But he didn’t get that first class upgrade and he probably will never get to use his Dividend Miles because he still can’t find his account number and password.  So much for their frequent-flyer loyalty program.  Next time he says he’ll take Southwest to Philly. By the way, after this experience he sold his shares in U.S. Airways.

The telephone representative did nothing wrong.  She couldn’t help it that the company information system she relied on didn’t have the information my friend wanted.  Was anyone responsible for his bad brand experience? Yes, enterprise marketing was responsible.  Enterprise marketing was responsible for not ensuring that the IT department linked Dividend Miles redemption to membership records. 

Can such a small thing hurt the company’s market value? Yes, if it happens to enough customers.  How many passengers did U.S. Airways lose every day because of poor brand experiences caused by this “little” slip up?  US Airways management didn’t know the answer to this question because they didn’t have that information.

The salary and fringe benefits of the Dividend Miles rep probably were reported in the company's "General & Admiistrative" expense account. Since that's not a "marketing expense" it has no impact on customer or investor perceptions and behavior. Right? Wrong!

Every connection, between every employee and every customer or investor, no matter how seemingly trivial, has an effect on their perceptions and behavior. This is why we must upgrade the role of "marketing" to the enterprise level. What better way to make this happen than to collect all the costs recorded in the accounting system that might affect customer and investor perceptions as "enterprise marketing expenses."

MICROSOFT'S RED, WHITE & BLUE DOLLARS
This graph shows Microsoft's red, white and blue dollars for the year ending June 30, 2006. Enterprise Marketing consisted of three components: R&D expenses (14% of revenues); Sales and Marketing expenses (22% of revenues); and General and Administrative expenses (7% of revenues). These expenses capture the cost of virtually every company driven activity and event that that influences how customers and investors think, feel, and act toward Microsoft during the sales cycle.

Msft_red_white_blue_63007_p01

Microsoft's earnings before interest, taxes, depreciation and amortization were 36% of revenues. And the cost of revenues was 21%. Want to explore the possibilities for creating new market spaces -- blue oceans? Begin by talking with the folks in operations management.

MAPPING EXPENSES ONTO ASSET BASES
The Statement of General Accounting Standards No. 142 on Goodwill and Intangibles requires that "Costs of internally developing, maintaining, or restoring intangible assets (including goodwill) ... shall be recognized as an expense when incurred (section10, page 10)." In other words, even if these expenses map directly onto the seven asset bases identified in the Harvard Management Update "Getting a Grip on Intangible Assets" they cannot find their way to the balance sheet.

That Harvard Update was based on an unpublished Financial Accounting Standard Baord (FASB) study of the different categories of operating expenses that influence intangible assets. The seven asset bases identified in the study are:

    • Workforce-based assets
    • Technology-based assets
    • Customer-based assets
    • Market-based assets
    • Organization-based assets
    • Contract-based assets
    • Statutory-based assets

This table aligns the cost of revenues and Microsoft's enterprise marketing expenses with these seven "asset" bases.

Msft_asset_base_table_63007_p01

We can map enterprise marketing expenses on six of the seven "asset" bases with which they are associated. R&D expenses contribute to Microsoft's Technological "asset" base. Sales and marketing expenses contribute to its Customer and Market "assets." General and Administrative expenses contribute to Microsoft's organizational, contractual, and statutory "assets." But how do we measure their affect on Microsoft's unaccounted for market capitalization? That is the $154 billion dollar question I asked in the title to the last post in this series.

OPTIMIZING "RED OCEAN" EXPENSES
To begin to answer the question about Microsoft's $154 billion in unaccounted market value we need to compare its actual enterprise marketing "red ocean" expenses with its maximum earnings expenses. If actual expenses exceed those which maximize earnings, the company is throwing money down the drain. If actual expenses fall short of those which maximize earnings the company is leaving money on the table. Either way the market will read the tea leaves and adjust the company's market price accordingly. If Microsoft over-spends on enterprise marketing, that will decrease earnings and depress market value. If the company under-spends on enterprise marketing that too will depress earnings and market value for failing to capitalize on competitors' weaknesses. To maximize shareholder value management must hit the "sweet spot" – the spending level that maximizes earnings.

In 2006 Microsoft management spent $21.9 billion, or 43% of revenues, on enterprise marketing in the management of its "red ocean" expenses. Want to find out if they maximized earnings? Then stay tuned in to this series.

Thanks for viewing.

~V

September 23, 2007

Accounting For The Unaccountable

Interbrand's estimate of the 2006 market value of the Microsoft (NASDAQ: MSFT) brand name is $58.7 billion. The value of goodwill and intangibles on Microsoft's balance sheet at the close of its fiscal year on June 30, 2007 was $5.6 billion.  The difference of $53.1 billion documents the inability of the company's balance sheet to capture the value of one of its most important market-based assets: the Microsoft brand name. But it does not even begin to reflect what I call the company's "unaccountable." This is the market value that remains unaccounted for after the summation of all "accountable" measures of asset values.

BRAND NAMES IN ENTERPRISE MARKETING
Corporate brands play a much more significant role in enterprise marketing than they do in traditional micromarketing. In fact, much of my book "Competing for Customers and Capital" is dedicated to highlighting the larger role of corporate brands and providing directions on how to deal with it. This is the 6th post in my series designed to document the larger role of corporate brands using real-world, real-time examples backed with published financial data.

The first post in the series was "Sears Brand Bonds," which took a look at how Edward Lampert captured the difference between the book value and the market value of the Sears brand name by issuing brand bonds. The second post applied these ideas to "Coca-Cola's Brand Bonds" to illustrate how the company might create new market value for its 200 lesser known brand names and, at the same time, resolve the ongoing battle with its bottlers. The third took a marketing oriented look at how to create value by co-branding a company's trademark and ticker symbol in Put a Little LUV in Your Logo!. The fourth post on "Brand Value vs. Book Value" was a broad-brush portrayal of the difference between Interbrand values and book values of 49 of the most valuable brands on the planet. My fifth post in the series took this broad-brush analysis a step further by examining the "Interbrand Value vs. Market Cap" of the same 49 valuable brand names. This article focuses on the panoramic view of how all three measures of the value of a company's assets can miss a huge chunk of its market value ... this is what I call the "unaccountable." I picked Microsoft for the analysis because it's the second most valuable brand in the world, after Coca-Cola (NYSE: KO).

MICROSOFT'S ACCOUNTABLES
The three existing measures of the value of a company's assets are (1) the book value of tangible assets, (2) the book value of goodwill and intangible assets, and (3) Interbrand value. In principle all three are what I call "accountables," because the first two already appear on a company's balance sheet and the third may yet find its way there.

Accounting rules that govern the book value of goodwill and intangibles are documented in the Financial Accounting Standards Board [FASB] Statement No. 142 on Goodwill and Intangible Assets issued in June, 2001. A quick take on this one-hundred and ten page document is available in the FASB Summary Statement No. 142.

It's clear from the headline to this post that the Interbrand value of Microsoft's brand name does not appear on its balance sheet. This simple fact provides a glimpse, when it comes to intangibles, of how reluctant financial accountants are to work with all the tools given them by the FASB. Here's what the Board says in its detailed statement on Goodwill and Intangible Assets:

The fair value of an asset (or a liability) is the amount at which that asset (or liability) could be bought (or incurred) or sold (or settled) in a currant transaction between willing parties, that is, other than in a forced or liquidation sale (# 23, page 13).

Since Microsoft is not about to sell its brand name to anyone, that seems to be the end of it. But it's not. On the next page, the FASB statement continues:

If quoted market prices are not available ... A present value technique is often the best available technique with which to estimate the fair market value of a group of net assets (such as a reporting unit). If a present value technique is used to measure fair value, estimates of future cash flows used in that technique shall be consistent with the objective of measuring fair value (# 24, page 14).

This reads like the methodology that Interbrand uses to measure brand value. So, why does Microsoft not take advantage of this option to value its brand name? I don't know the answer to this question. Perhaps some up and coming Microsoft employee does?

MICROSOFT'S UNACCOUNTABLE
In this chart I divided Microsoft's $276.4 billion market cap into the "accountables" and the "unaccountable." The accountables appear on the right-hand side of the pie. If Microsoft were to use Interbrand's methodology to value its brand name it would appear on the balance sheet as a $58.7 billion intangible asset. Its tangible assets were worth about the same as its brand name, or $57.5 billion. The combined value of the goodwill and intangibles that actually are reported on its balance sheet was $5.6 billion.

Msft_unaccountables_63007_p01

If you were to subtract the sum of the accounted for values ($122.9 billion) from Microsoft's market cap ($276.4 billion) you find its unaccounted for value on June 30, 2007 was $154.5 billion.

ACCOUNTING FOR THE UNACCOUNTABLE
Here's Microsoft's $154 billion dollar question: How can you account for the unaccountable? My hope is this post drives home the importance of finding an answer to this question. Fully 56% of Microsoft's market capitalization appears to materialize by magic! And that's only if you include the 21% represented by its Interbrand value.

Is it possible to account for the unaccountable? What do you think?

Thanks for viewing.

~V

September 16, 2007

Interbrand Value and Market Cap

The Interbrand value of Tiffany (NYSE:TIF) is 75% of its $5.3 billion market capitalization. That's no surprise. Tiffany is, above all else, the brand. But the Interbrand value of Johnson & Johnson (NYSE: JNJ) is just 2% of its $191 billion market cap. How do you explain these differences? That's the purpose of this article.

This is the 5th in my series of posts on brands in enterprise marketing. The first, "Sears Brand Bonds," was followed by "Coca-Cola's Brand Bonds." The 3rd article was on "Put a Little LUV in Your Logo!" And last week's was on "Brand Value vs. Book Value." In this post I compare Interbrand valuations with the market capitalization of the same 49 top 100 global brands in their 2007 report. The approach is based in part on an analysis of intangible market value in my book Competing for Customers and Capital.

A FALSE COMPARISON
I've learned at least one thing from posting these blogs: when you get it wrong, someone will let you know! In response to my last post Johathan Knowles, a widely respected consultant whose focus is on the branding dimension of business strategy, had this to say in an email:

I think the whole discipline of relating brand value to some financial metric is laudable - but I think you have chosen the wrong metric. As you know, the accounting regulations only allow for ACQUIRED intangibles to be shown on the balance sheet. The companies with the most disclosed intangibles are therefore those that have done the most - or the largest - acquisitions involving a significant amount of goodwill. It is no surprise that the acquisitive Citi has a low ratio and the non-acquisitive Harley has a stratospherically high one. Comparing overall brand value to disclosed intangibles is therefore a false comparison. The more meaningful question is to analyze what proportion of overall value (and of intangible value) is represented by brands.

Jonathon Knowle's comment motivated me to take a look at brand value and market cap. I think you'll find the results interesting.

A MORE MEANINGFUL COMPARISON
The following chart shows the Interbrand value for each of the 49 top brands as a percent of the company's total market capitalization. Tiffany is at the top of the list with a brand value that is 75% of its market cap. Johnson & Johnson is at the bottom with a brand value that is just 2% of its market cap.

Interbrand_value_to_market_value

The combined market cap of all 49 brands in 2006 was $4.294 tillion. The combined value of these brands was $735.5 billion. Overall brand values accounted for 17% of market cap. That's not a trivial number. But, I wondered: why the huge difference between Tiffany and J&J? So I ploted the percent of Interbrand value to market cap against the market cap of each company.

BRAND VALUE DECLINES WITH MARKET CAP
This chart shows how these 49 Interbrand values stand in relation to each company's market cap. Brand value as a percent of market cap declines systematically as company size increases. Market cap in billions appears on the vertical axis, with Interbrand value as a percent of market cap on the horizontal axis.

Interbrand_value_market_value_2

General Electric (NYSE: GE) is at the top of the chart at 13.5% of its $382 billion cap and Tiffany is at the bottom with 75% of its $5 billion market cap. Microsoft (NASDAQ: MSFT) and Citigroup (NYSE: C) also fit the expected pattern between size and brand value.

FORCES DRIVING INTANGIBLE VALUE
Three powerful forces drive brand values to decline as a percent of market cap: these are company size, market volatility, and other intangibles.

  1. Company Size: Very big organizations have a lot more going for them than their brand name, even though it may have extraordinary value. GE's Interbrand value of $51.6 billion is just below IBM’s (NYSE: IBM), which makes GE one of the most valuable brands on the planet. But the GE brand is a relatively small (13.5%) part of GE's $382 billion market cap.
  2. Market Volatility: Interbrand values are long run projections of the present value of cash flows. This makes them less volatile than market values. So, stocks that get beat up in the market will have a higher percentage of capitalization associated with their Interbrand value. Fitting this pattern are Ford (NYSE: F) and Eastman Kodak (NYSE: EK).
  3. Other Intangibles: The impact of other intangibles on market capitalization is the final and most important factor driving value. The results of an FASB study of these factors were summarized in a Harvard Management Update in 2001: Getting a Grip on Intangible Assets. These are the seven dimensions of intangible shareholder value identified in that study:

> Technology (e.g. R&D)
> Customers (e.g. mailing lists)
> Markets (e.g. brand names)
> Workforce (e.g. management)
> Organizational (e.g. policies)
> Contracts (e.g. royalties)
> Statutory (e.g. patents)

LINKING INTANGIBLES TO MARKET CAP
The fundamental challenge of enterprise marketing is to link spending on these seven intangible drivers to shareholder value. Can it be done? What do you think?

Thanks for visiting.

~V

September 09, 2007

Brand Value vs. Book Value

The brand name "Harley-Davidson" (NYSE: HOG) has a market value of $7,718 million according to the 2007 Interbrand report. Yet, in its 2006 financial statement the company reported the value of intangible assets is just $59 million. Let's see, that means the name value is 131 times greater than the book value.

What's going on here?  In her article in the Sunday Times Denise Caruso, executive director of the Hybrid Vigor Institute, had this to say about valuing corporate assets:

TODAY’S sophisticated knowledge economy is stuck with the equivalent of an abacus for measuring the actual financial value of corporate assets and liabilities. At issue is a growing collection of crucial resources known as intangibles: assets or liabilities that have no obvious physical presence, but that represent real value or vulnerabilities. Patents, trademarks, copyrights and brand recognition are most commonly recognized as intangibles.

To drive home her point, the value of Harley-Davidson's corporate brand is 40% greater than the value of the company's total assets of $5,532! And it accounts for 42% of the company's market cap of $18.2 billion. What does Interbrand know that HOG's accountants don't know: the power of a brand name.

BusinessWeek chose Interbrand's methodology because it evaluates brand value in the same way any other corporate asset is valued—on the basis of how much it is likely to earn for the company in the future. Interbrand uses a combination of analysts' projections, company financial documents, and its own qualitative and quantitative analysis to arrive at a net present value of those earnings.

This is the 4th in my series of posts on brands. The first, "Sears Brand Bonds," was followed by "Coca-Cola's Brand Bonds." And last week I posted an article on "Southwest Airlines: Put a Little LUV in Your Logo! " In this post I compare the book value of intangible assets with the market value that Interbrand places on 49 of the top 100 global brands. The approach is based in part on an analysis of intangible market value in my book Competing for Customers and Capital.

SOME BALANCE SHEETS COLLIDE WITH REALITY
Few of Interbrand's top 100 companies undervalue intangible assets to the extent that Harley-Davidson did. But it's not alone in the stratosphere of intangible miss-valuations. Tiffany & Company (NYSE: TIF) is in the same orbit with a brand value to book value ratio of 130. Interbrand's valuation of Tiffany's is $4,003 million with a balance sheet intangible value of just $31 million. Not far behind is Gap's (NYSE: GPS) ratio of 114 which is based on a brand value of $5,481 versus a book value of $48 million.

Only 49 of Interbrand's top 100 best brands reported the data necessary for this analysis based on S&P's COMPUTSTAT database in 2006 downloaded from Wharton Research Data Services. The most important cause of missing data was due to foreign companies not listing on U.S. stock exchanges. And most offshore financial accounting regulations do not require (or do not recognize) "intangible assets" at all.

Consider the top 28 most valuable brands that reported intangible assets on their balance sheets, where these assets were less than half their Interbrand value. If you add up the Interbrand valuations ($475.5 billion) and compared them with their balance sheet value of intangibles ($65.9 billion) you get a miss-valuation ratio of 7.2 times.

SOME BALANCE SHEETS FLIRT WITH REALITY
To be fair to the accountants for companies that own 14 brands in the top 100 most valuable brands have book values that are "pretty close" to Interbrand's valuations. My measure of "pretty close" is that Interbrand valuations are no more than double the balance sheet values and these in turn are no more than double the Interbrand values. On the high end of this range is Kellogg (NYSE: K) with intangibles valued at $4,868 million on its 2006 balance sheet with an Interbrand value of $9,341 million. On the lower end is Citigroup (NYSE: C) with an intangible asset value of $49,316 million compared with an Interbrand value of $23,443.

The combined book value of intangibles reported by these 14 companies is $200.9 billion. Their combined Interbrand value is $192.7 billion. The brand to book value ratio is about one. To view the data on which this post is based Download the_power_of_a_name.xls

WHAT DRIVES INTANGIBLE VALUE?
For a preliminary answer to this question see my post on "Intangible Value Drivers." If you really want to know how enterprise marketing expenses drive intangible market value, and in turn add to (or diminish) shareholder wealth, read my book Competing for Customers and Capital. Then tell me what you think.

Thank you for viewing.

~V

September 02, 2007

Put a Little LUV in Your Logo!

In the first meeting of my undergraduate elective "Competing for Customers and Capital" at Tulane University I projected the following word on the computer screens in very large letters:

LUV

Then in the big classroom, speaking softly into my lapel mike, I asked:

What company owns this brand name?

My question was greeted with stunned silence. The students quietly discussed what it might be. Finally someone asked: Is it Procter and Gamble's brand of disposable diapers?  To which I replied: Close but no cigar. LUV actually is the ticker symbol for Southwest Airlines.

Everyone said: We knew that -- but a ticker symbol is not a brand name! To which I replied: On Wall Street it is.

This is the 3rd in my series of posts on brands in enterprise marketing. The first, "Sears Brand Bonds," was followed by "Coca-Cola's Brand Bonds." In this post I take an entirely original approach to co-branding from the first page in my book Competing for Customers and Capital.

CLEVER TICKERS
In his July 13, 2007 article published on Zacks Investment Research web site, Jim Licato asks the following questions:

Do stocks with clever ticker symbols outperform or under-perform the overall market? Do investors interpret such symbols as silly marketing ploys or will they recall memorable ticker symbols when they are contemplating which stocks to add to their portfolio? Well, these are the questions that Professor Gary Smith at Pomona College in California asked himself.

He's referring to a working paper by Alex Head, Gary Smith, and Julia Wilson titled "Would a Stock by Any Other Ticker Smell as Sweet?" Here's the abstract of their paper:

Some stocks have clever, eye-catching ticker symbols: for example, LUV (Southwest Airlines), MOO (United Stockyards), and GEEK (Internet America). These clever tickers might be a useful signal of the company's creativity, a memorable marker that appeals to investors, or a warning that the company feels it must resort to gimmicks to attract investors. This paper investigates the performance of stocks with clever ticker symbols during the years 1984-2004. Surprisingly, a portfolio of clever-ticker stocks would have beaten the market by a substantial and statistically significant margin, contradicting the efficient market hypothesis.

The authors found that 51 clever-ticker stocks delivered annual compound returns of 23.5% compared with the whole NASDAQ/NYSE portfolio which delivered returns of 12.3%.

FLUENT TICKERS
Adam Alter and his major Professor Daniel Oppenheimer of Princeton University's Psychology Department studied a refined property of tickers they dubbed "processing fluency."  To do so they gathered data on the rate of return on IPOs over 14 years. Their study, published in the Proceedings of the National Academy of Sciences

... investigated the impact of the psychological principle of fluency (that people tend to prefer easily processed information) on short-term share price movements. In both a laboratory study and two analyses of naturalistic real-world stock market data, fluently named stocks robustly outperformed stocks with disfluent names in the short term (abstract).

The 3rd in their series of studies is most relevant here because it examined

... the effects of fluency on stock performance in a semantically impoverished context: by using the pronounceablity of each company's three-letter stock ticker code as a predictor of performance (page 9370).

A fluent ticker was one that could be pronounced [e.g. KAR] compared with one that could not be pronounced [e.g. RDO].

The results of the 3rd study were quite interesting. The authors calculated the excess profits earned by an investment of $1,000 in the basket of NYSE and AMEX stocks with pronounceable tickers compared with non-pronounceable tickers. On the first day of the IPO the excess yield was $83.35. At the end of one week the excess yield was $42.40. After six months it was $37.10. Even after one year the excess was $20.25. Their tests for company size and industry effects were not significant.

SEMANTICALLY IMPOVERISHED TICKERS
Interbrand recently released its 2007 list of the 100 most valuable brands in the world. Fourteen of the top 15 brands also have a ticker symbol. How many of the following tickers (in alphabetical order) are pronounceable?

   AXP, BMW, C, DAI, DIS, GE, HPQ, IBM, INTC, KO, MCD, NOK, MSFT, TM

Only five of the tickers (in green) owned by 14 of the top 15 most valuable brands in the world are pronounceable. But none are particularly clever. And the other nine are more or less semantically impoversided.

It turns out that at least 80 of the 100 most valuable brands in the Interbrand list also have ticker symbols. The other 20 brands are owned either by private companies or are divisions of public ones. Only 15 of the 80 are pronounceable. Among the remaining 65 tickers the most semantically challenged are 005930 (Samsung on the Korean Stock Exchange) and RTRSY (Reuters on the NASDAQ). Only four of the pronounceable tickers are as clever as LUV. These are BUD, CAT, HOG and PEP.  Why was LUV not included in the fluency study? Because Southwest Airlines was not among the stocks listed in the Global New Issues Database from 1990 through 2004.

WHY NOT PUT LUV IN THEIR HEART?
If LUV is the brand name for Southwest Airlines (NYSE: LUV) on Wall Street, then why didn’t my students know this? It's probably because undergraduate seniors, even in a business school, don't trade many stocks on their own. But this raises a more important question: what would be the impact on its stock price if Southwest's management were to co-brand its corporate logo and its ticker symbol? Let's see, the company's logo is:

Swa_logo_empty

That red heart with wings makes co-branding easy. Why not put LUV in their heart? 

Swa_logo

Just because it's easy, doesn't mean co-branding will succeed.

CAN CO-BRANDING TICKERS AND TRADEMARKS SUCCEED?
In their book Co-Branding: The Science of Alliance, Tom Blackett and Bob Boad write that:

... the term 'co-branding' is relatively new to the business vocabulary and is used to encompass a wide range of marketing activity involving the use of two (and sometimes more) brands. Thus co-branding could be considered to include sponsorships, where Marlboro lends it name to Ferrari or accountants Ernst and Young support the Monet exhibition ... The list of possibilities is endless. (page 1).

Would these authors consider combining trademarks and tickers as one of those endless possibilities? Tickers are not listed in the index to their book.  And my students said a ticker symbol is not a brand name. But ticker symbols have all the salient characteristics of a brand name.

The ticker symbol is a unique proprietary asset. It is a financial trademark. It stands as assurance to investors that buying it will deliver a genuine share of a company's stock. Because the ticker symbol practically is the product, it's superior to a trademark: even if you buy a share of LUV online you know you get a genuine Southwest Airlines common stock, unlike when you buy a Gucci bag or a Cartier watch on a city street.

Stock markets and product markets operate separately, but interact in many subtle ways.  Maybe more passengers would become stockholders, thus driving up the demand for Southwest Airline shares, if they saw LUV in the logo at the front of their Boeing 737.

Would it pay to mary your company's ticker to its trademark? It might, if that ticker were clever or fluent ... or both. What do you think?

~V