« October 2007 | Main | December 2007 »

November 2007

November 25, 2007

Enterprise Marketing and The Bottom Line

When was the last time you were faced with a choice between strategic business alternatives that appeared to be mutually exclusive – "A" or "B" but not both? This seems to be the problem facing The New York Times Co (NYSE: NYT) in searching for ways to monetize its content online. If, however, Mr. Sulzberger were to a look at his choices through the lens of enterprise marketing he might discover "A" and "B" aren't mutually exclusive after all.

What's so special about looking through the lens of enterprise marketing? Two things come to mind. First, an enterprise marketing analysis optimizes the cost of all the expenses that influence how investors, customers, and consumers perceive a company and its products. Second, the competitive risks of a strategy are built into the analysis from the very first right up through the last step.

COMPETING FOR CUSTOMERS AND CAPITAL
Most economists assume it's not possible to operate as a public trust and -- at the same time -- maximize profits. My last post, "The New York Times Co: Public Trust vs. Maximum Profits," showed that in the case of The Times this assumption did not stand up to the data. The company remained a public trust and maximized profits in 2006. The purpose of this post is to further that conclusion by documenting how a reconciliation of the strategic alternatives faced by The New York Times Co. leads to an EBITDA of $7 a share by 2010. When you consider the company earned just under $2 a share in 2006, hitting this earnings target presents management with no mean feat.

This analysis goes back to the original post in a series on newspapers that began on June 3, 2007 with "Dow Jones: Anomaly or Hidden Value?" In that article I placed The Times in a strategic group with Dow Jones (NYSE: DJ), the Gannett Company Inc. (NYSE: GCI), and the Tribune Company (NYSE: TRB). A strategic group is a set of companies that share a customer base and have comparably deep pockets. In newspapers the “shared customers” are advertisers. This report is based on the same 10 years of financial accounting data I used in that earlier post.

IRRECONCILABLE DIFFERENCES
Anthony Bianco's cover story of Business Week on January 17, 2005 titled "The Future of The New York Times" quotes John Battelle, a co-founder of Wired, with an apparently irreconcilable strategic choice:

The business model that seems to justify the expense of producing quality journalism is the one that isn't growing, and the one that is growing -- the Internet -- isn't producing enough revenue to produce journalism of the same quality.

In the same story he reports that "... disagreement rages within the company over whether NYTimes.com should emulate The Wall Street Journal and begin charging a subscription fee. Undoubtedly, many of the site's 18 million unique monthly visitors would flee if hit with a $39.95 or even a $9.95 monthly charge."

For years management has been working on a product that delivers enough value to sell profitably online. In October 2001 The Times launched the Electronic Edition -- an exact replica of the New York City print edition. I subscribed to it, then let it expire. That version preserved the exact look of the print edition, which was great. But that facsimile format made it very cumbersome to manage on a computer screen. You could zoom in, but then you lost the most of the content. Moving from one page to the next, even on a broadband connection, took a few seconds. You could move only one page at a time, but you couldn't actually turn the page. That edition is still available with these same shortcomings at $14.99 a month. For this post I renewed my subscription. Nothing has changed. You can't even turn a virtual page electronically!

A BIG MISTAKE
If you subscribe to the Sunday Times you probably noticed recently the insert Introducing Times Reader promoting A new way to experience The Times. The Times Reader lacks the look of the electronic facsimile, but it features high level functionality. Like automatic scaling of text and images to fit your screen even when you change font size. And you can move from section to section and back with one click. It does not include some very important stuff from the company's main web site NYTimes.com. All the web logs and interactive features are excluded. Yet this brilliant, if accidental exclusion, completely differentiates the Times Reader.

Apparently management does not hold this view. When you go to the Home Delivery link on NYTimes.com (and enter your ZIP code) you will find the Times Reader is promoted as a "$169 Annual Value ... free to Subscribers." There goes $14.08 a month down the drain. Big mistake!

A DOTCOM BY ANOTHER NAME ISN'T THE SAME
I was raised in a family of newspaper non-readers. Probably because we lived on military bases around the world where home delivery was out of the question. So I never learned to ignore printer's ink on my fingers, the piles of old newspapers, and the uncertainties of home delivery. I never regularly read a newspaper till they created NYTimes.com. For years it's been my home page. While I don't have to put up with the shortcomings of print editions, the NYTimes.com has problems of its own. First, there's the formatting. Enlarge the type face and everything goes out of whack. Second, getting from one section to another requires too many clicks. Third, finding yesterday's news in archives is a pain in the neck. And if older than yesterday's news there's an extra charge.

Prodiucts_and_prices

I happily will keep my subscription to the Sunday Times at $6.50 a pop (I've learned to deal with a newspaper once a week!). And I'll subscribe to the Times Reader at their advertised price of $14.08 a month. I suspect a large percentage of the 18 million unique monthly readers of the NYTimes.com will do the same. If, over time, even 30% of those 18 million monthly visitors subscribe to the Times Reader at $14.08, the income from it will match the $890 million earned from sales of the Times Newspaper in 2006. The 70% who don't, won't know the difference. And ad revenues won't fall because those who subscribe to the Times Reader will still visit NYTimes.com for its blogs and other interactive features. In fact, free of its editorial responsibilities, the NYTimes.com can be enriched with even more interactive features. 3D Cross-Word puzzle anyone?

A good friend of mine loves reading the newspaper: every day, every page, front to back. She loves the printers ink and saves the old papers for other uses. For which she has many as a 2D artist. To her there's also something special about turning the pages. Reminder to Mr. Sulzberger: the Times Newspaper won't go out of style anytime soon.

INVIGORATED INCOME STATEMENT
The financial impact of monetizing The Times high quality content on the Times Reader isn't just volume. It's also gross margin. In 2006 the Times Newspaper had a gross margin of 53.5%, down from 64.5% in 2000. The cost of moving content to the reader probably is very small: maybe 10% at the outside. When the volume of Newspaper and Reader equalizes, combined gross margins will be about 68%.

The following table presents the actual (2006) and Pro Forma (2010) income statements that lead to EBITDA per share of $7, along with the percent changes in each line item.

Nyt_proforma_0610

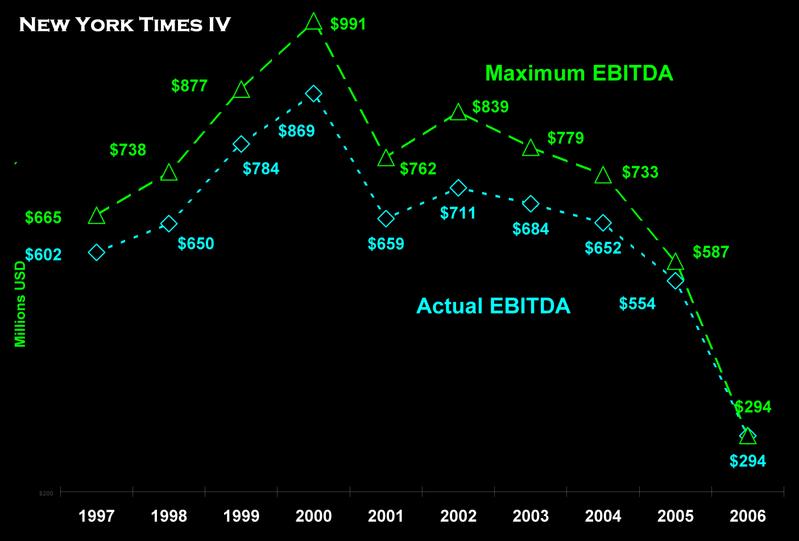
These results assume strategic group revenue increases at the same modest 3.8% CAGR of the last decade, growing from $18.6 billion in 2006 to $21.6 billion in 2010.  Actual market share of 17.7% in 2006 jumps 9 points to maximum earnings market share of 26.7%. The marginal value of a share point increases dramatically as a result of higher gross margins, making it profitable to buy more share points. The effect of modest growth in group revenue combined with a 50% increase in market share drives revenue up 75% from $3.29 to $5.76 billion by 2010. And larger gross margins mean relatively lower costs of production, up just 19%.

The financial impact of this strategy really kicks in with gross operating profits, which increase 124% from $1.760 to $3.936 billion in 2010. The SG&A expenses required to support a 27% market share nearly double. But earnings nearly triple from $294 million to just $1.05 billion. EBITDA per share hits $7 while earnings to revenue double. SG&A to revenue increases only 12%. The Times Reader not only makes NYT much more profitable, it's also more efficient to deliver.

WHAT'S THE NYT PRICE IIN 2010?
A simple way to estimate NYT's price is to multiply its 2006 Price/EBITDA ratio of 12.3 by forecast earnings in 2010. This suggests a price of $87 in current dollars. Remember, that $7 earnings figure assumes management continues to optimize its SG&A expenses every year just as they did in 2006.

The NYT price also is contingent on the actions of competitors. Since Dow Jones soon will be under new leadership, with deeper pockets and an equally powerful brand name, the valuation of NYT must take DJ and its other competitors into account. That's exactly what the competitive stock valuation model in my book Competing for Customer and Capital is designed to do. In the next post in this series I'll apply that model to valuation of the NYT. We'll see if it adds enough information over and above that contained in the P/E ratio to make it worth the extra effort.

The Times Reader solves the problems of both the paper and online editions. It's my ideal product. It also can solve the company's problem of monetizing its content online. The solution is simple: charge separately for The Times Newspaper, Electronic Edition, and Times Reader while keeping the NYTimes.com free.

~V

November 18, 2007

Public Trust vs. Maximum Earnings

In his 24/7 Wall Street post on Friday November 16, 2007 Douglas McIntyre published the latest of many unsettling predictions about the future of newspapers:

There is little left for the newspaper industry other than to cut people. Paper and delivery costs have already been taken down. The costs of printing and production cannot be brought lower. That leaves headcount.

While he didn’t say so, this conclusion speaks directly to The New York Times (NYSE: NYT) because of what its most vocal critic sees as the companies prolific spending on, among other things, headcount. That critic, Mr. Hassan Elmasry of Morgan Stanley (NYST: MS), blames the company’s ownership structure on management's freedom to engage in this "overspending." In his October 17, 2007 post "Morgan Stanley Walks Away From New York Times Fight" on BloggingStocks, Tom Barlow wrote:

The Global Franchise fund, which looks for undervalued but world-renowned brands, spent the first part of 2007 in a full-court press, attempting to change NYT's direction. Among Elmasry's concerns were (in his view) overstaffing, the cost of a new headquarters, a flawed internet strategy, and too-generous option grants.

The reason for the New York Times "curious ownership structure" is the belief that newspapers in a democracy are a public trust. In the May 13, 2007 edition of The Becker-Posner Blog Professor Posner wrote:

The idea is that if people unrelated to the founder … controlled the newspaper, they would manage it with the aim of maximizing profits and thus would give the consumer what he wanted rather than what he needed in order to be an informed citizen.

This belief, of course, implicitly assumes it's not possible to operate as a public trust and -- at the same time -- maximize profits. The purpose of this post is to show that in the case of the Times this assumption does not stand up to the data. The company remains a public trust while maximizing profits.

MAXIMUM EARNINGS MARKET SHARE
In a post on June 3, 2007, "Dow Jones: Anomaly or Hidden Value," I placed the Times in a strategic group with Dow Jones (NYSE: DJ), the Gannett Company Inc. (NYSE: GCI), and the Tribune Company (TRB). A strategic group is a set of companies that share a customer base and have comparably deep pockets. In newspapers the “shared customers” are advertisers. This report is based on the same 10 years of financial accounting data I used in that earlier post.

Maximum earnings market share occurs when the marginal cost of the next share point is equal to its marginal earnings -- net of “enterprise marketing expenses.”  For the details on accounting for these expenses see my book Competing for Customers and Capital. In the newspaper industry enterprise marketing expenses are listed in the income statement as "Selling, General & Administrative expenses." Most of these expenses fall into the category of “headcount.”

The following chart compares the NYT's maximum earnings market share with its actual market share from 1997 through 2006. In 1997 the company's maximum earnings share of the group's $12.9 billion revenues was 30.5%. Its actual market share was just 22.2%. Conclusion? In that year NYT management was seriously under-spending on enterprise marketing.

Mems_p01

But by the close of business in 2006 management had successfully driven their revenues and expenses to the point where the company’s maximum earnings market share (17.2%) and actual share (17.7%) were separated by only 50 basis points. How did they pull this off?

The following chart reveals the truth about the management of earnings and expenses at the NYT. The company's marginal earnings per basis point (that's 1/100th of a share point) were $0.72 million in 1997, when its marginal cost per basis point was just $0.57 million.

Ppp_cpp_p01

By the close of business in 2006 NYT’s management had brought their marginal earnings and expenses into near perfect alignment at $1 million per basis point.

THE NEWSPAPER OF RECORD
There's a simple analog to the incremental cost per basis point that's a lot easier to calculate and understand. It's the average cost per dollar (CPD) of revenue.

Cpd_p01

This table shows a side-by-side comparison of the CPD for each of the four companies in this strategic group. In 1997 it cost the NYT 35¢ to generate $1 in sales revenue. That was twice what it cost GCI. Over the next nine years the NYT cost per dollar increased to 45¢, while GCI remained unchanged at 16¢ per dollar. By 2006 NYT management spent almost three times as much to generate a dollar of revenues as CGI and far more than either DJ or TRB.

While the critics call this overspending, the Times management probably would call it brand building. What did the company spend the "extra" money on? Some clues are given in Anthony Bianco's cover story of Business Week on January 17, 2005 titled "The Future of The New York Times:"

[Arthur Sulzberger] reinvented the "Gray Lady" by devising a radical solution to the threat of eroding circulation that had imperiled the Times and other big-city dailies for years. Sulzberger changed the paper itself by spending big money to add new sections and a profusion of color illustration.

At the same time, he made the Times the first -- and still the only -- metro newspaper in America to broaden its distribution beyond its home city to encompass the entire country. Today, nearly 50% of all subscribers to the weekday Times live somewhere other than Gotham.

In the mid-1990s, NYT Co. became one of the first Old Media companies to move into cyberspace ... Today, NYTimes.com consistently ranks among the 10 most popular Internet news sites ...

Did this spending actually build the brand? A study published in August 2007 by the Joan Shorenstein Center on the Press, Politics and Public Policy on "Creative Destruction: Exploratory Study of News on the Internet" found that:

Brand-name newspaper sites are gaining audience. Their traffic in April 2007 exceeded their April 2006 traffic by more than 10 percent, which corresponds to an average gain of nearly a million unique monthly visitors (page 7).

Building the brand's reach and supporting the company’s worldwide reputation as the newspaper of record is far more important then making sure last quarter earnings per share meet analyst's expectations. It is all the more important since management was able at the same time to maximize earnings. This is an achievement unmatched by the other newspapers in this group. In 2006 the Times relative earnings productivity [REP] was -0.1% -- meaning the company's actual earnings were only 1/10th of 1% less than maximum potential earning. In the same year the relative earnings productivity of GCI, TRB and DJ were -7.4%, -8.2% and -27.0% respectively.

ALL THE MONEY IT’S FIT TO EARN
In 1997 the company’s management fell $63 million short of maximum EBITDA. But by the close of business in 2006 actual and maximum earnings were exactly equal at $264 million.

Ebitda_p01_2

The downward trend in the Times earnings is severe and reflects the hard times also suffered by Dow Jones. Given that fact, if you will forgive me a paraphrase of the Times masthead, the company is making all the money its fit to earn while continuing to build the brand in a harsh environment.

INVESTOR MYOPIA
Anthony Bianco's cover story is perhaps the most comprehensive, unbiased account to date of the Times performance under the leadership of Arthur Sulzberger, Jr. That article sums up the two major issues affecting its future today -- economics and politics:

In essence, Sulzberger is doing what his forebears have always done: sink money into the Times in the belief that quality journalism pays in the long run. "The challenge is to remember that our history is to invest during tough times," he says. "And when those times turn -- and they do, inevitably -- we will be well-positioned for recovery."

Investors continue to discount the company’s stock in part because of Mr. Hassan Elmasry's "full-court press." His battle with the Times over ownership structure and spending clearly took its toll on the stock. Now that this two year assault is settled, there remains the deeper issue highlighted in the Business Week cover story: the ideological divide within the country.

What a growing, or at least increasingly strident, segment of the population seems to want is not journalism untainted by the personal views of journalists but coverage that affirms their partisan beliefs...

Does all this add up to a case of investor myopia? What do you think?

Thanks for visiting.

~V

November 11, 2007

Johnny Begood and the Mispricing of Intellectual Capital

Why does a PhD teaching ethics in the Philosophy department of a university make less than half as much as he could teaching ethics in its business school? Because the intellectual capital created by PhD degrees in many of the academic disciplines is seriously mispriced by American universities. How might that mispricing be corrected? One answer to this question is presented in this post.

JOHNNY BEGOOD
In junior high school Johnny Begood loved to read the classics. When the other kids spent their spare time practicing on their skateboards, Johnny could be found in the library reading Plato. Naturally he majored in philosophy in college and earned his PhD from an Ivy League University in 2003. He wrote his dissertation on the meaning of life.

Following his graduation Dr. Begood accepted a position at a small, but prestigious, private university in New England. Today he is a tenured associate professor teaching ethics in the Philosophy Department. In a recent conversation I asked him about his salary. He said “I make less than the local high school football coach.”

MISPRICING OF INTELLECTUAL CAPITAL
Their faculty represents the intellectual capital in American universities. Yet in the academic disciplines that capital is systematically mispriced on almost every campus. In the 2006-07 survey of starting salaries assistant professors in philosophy and physics averaged $47,894 and $52,395 respectively. It’s pretty much the same story across the board. For example psychology professors started at $50,406 and sociology professors at $49,019.

In the same academic year, on many of the same campuses, the starting salaries for professors in business schools averaged around $103,000.

Of course there are huge variations from these averages for top private universities compared with public universities and small private colleges. But whether using averages or outliers to compare salaries in the academic disciplines with those in the business disciplines in American universities one finds a significant mispricing of intellectual capital.

IMBALANCE IN DEMAND AND SUPPLY
You don’t need to look very far to discover the underlying reasons for this mispricing. First, there has been a large growth in the demand for business education both within the American market and around the world. At the same time the supply of academically qualified (PhD) business faculty has been shrinking for years. Due both to a drop in the number of PhDs produced by business schools and the retirement of senior faculty. Second, over the last decade the production of PhDs in the academic disciplines has held constant while the number of openings has shrunk. The constant production was due partly to university requirements for PhD output in the academic disciplines. And partly to the fact that many of the candidates for degrees in these fields aren’t in it for the money.

CORRECTING THE IMBALANCE
As you might expect the Association to Advance Collegiate Schools of Business [AACSB] International found a market-driven solution to correct the imbalance: train PhDs in the academic disciplines to do research and teach in business schools. Subsequently, invitations were sent to the deans of accredited schools to submit proposals on how to implement this approach. In September 2007 the AACSB board endorsed five “Post Doctoral Bridge to Business Programs.” The Freeman School at Tulane University is one of them. Full disclosure: I’m the faculty director of that program.

THE TULANE ADVANTAGE
Tulane's program provides faculty holding non-business doctorates with face-to-face classroom training in an area of specialty equivalent to that received by our full-time PhD students in Finance, Accounting, Organizational Behavior or Marketing. The curriculum is delivered during in-residence weekend seminars offered in an executive format, meeting three weekends (Friday, Saturday, and Sunday) in each of the fall and spring semesters and supported between classes by Adobe Connect discussions.

Most of these seminars are taught by the same faculty that teach in our full-time PhD program and deliver the same intellectual content. Candidates will receive graduate course credit in Tulane's Post Doctorate in Business (PDB) program. This one-year program prepares our graduates to conduct research in their chosen specialties and teach in AACSB accredited business schools worldwide.

The $40,000 USD tuition includes books, software, room and two meals each day during the entire program. Access to Tulane’s online library databases, file sharing suite, Wharton Research Data Services and research applications also are available throughout the year. The cost of seven trips to New Orleans is not included.

DO YOU KNOW A DOCTOR BEGOOD?
If you know a professor like Johnny Begood tell him (or her) about Tulane’s program. Their training and teaching experience combined with our post doctoral program not only could double their salary, it could be more fun!

November 04, 2007

Blue/Red Ocean Stock Pricing -- A Reply

My blog is syndicated by Seeking Alpha. Sometimes the comments posted there cut right to the heart of the matter. For example, in response to "Google vs. Microsoft: Blue/Red Ocean Earnings Productivity" a reader posted the following comment:

I get the idea that marginal costs should equal marginal revenues to maximize earnings. But it's not clear to me why you think the models can be safely extrapolated out ... Particularly in the Microsoft case -- where the model shows actual REP at -36%.

The purpose of this post is to address the issue of extrapolating relative earnings productivity and risk-adjusted differentials for Google (NASDAQ: GOOG) and Microsoft (NASDAQ: MSFT) in the competitive stock valuation model. The details on how this model works are published in Chapter 9 of my book Competing for Customers and Capital.

RELATIVE EARNINGS PRODUCTIVITY
Relative Earnings Productivity [REP] is based on a simple principle. As management comes closer to optimal spending the difference between its actual and maximum potential earnings will decrease. When this happens, other things equal, investors will bid up the company's stock price in recognition of that extraordinary achievement. Consider what Al Rappaport says in the second edition of his classic 1986 book Creating Shareholder Value:

It is … productivity that the stock market reacts to when pricing a company’s shares.  Embedded in all shares is an implied long-term forecast about a company’s productivity – that is, its ability to create value in excess of the cost of producing it.  When the stock market prices a company’s shares according to a belief that the company will be able to create value over the long term, it is attributing [this belief] to the company’s long-term productivity or, equivalently, a sustainable competitive advantage.  In this way, productivity is the hinge on which both competitive advantage and shareholder value hang (Rappaport 1998, 69).

It was Professor Rappaport's insight that led me to formulate relative earnings productivity as one of the metrics needed to combine the concept of long-term efficiency with sustainable competitive advantage. But there is a link between efficiency and competitive advantage that I did not discuss in the post that prompted the comment above.

MARKET SHARE ATTRACTION THEORY
Market share attraction [MSA] theory says that, on average, in a competitive market a company will attract revenues in direct proportion to the share of expenses incurred in serving that market. The popularity of this model is based on several characteristics: it's logically consistent; it derives from four simple axioms; its parameters can easily be estimated; and it seems to outperform both linear and multiplicative models.

An interesting investigation into the properties of the [MSA] model is available in the 2001 paper "Why is Five a Crowd in the Market Share Attraction Model: The Dynamic Stability of Competition" by Paul Farris and his coauthors. Their analysis assumes that firms maximize earnings by optimizing their own spending based on competitors' last-period budgets and the MSA model.

RELATIVE EARNINGS PRODUCTIVITY
Since maximum earnings derived from the MSA model are nonlinear, so too is relative earnings productivity. This chart, reproduced from "Google vs. Microsoft: Blue Ocean vs. Red Ocean Earnings Productivity" shows relative earnings productivity for Google and Microsoft from March 2005 through June 2007.

They say a picture is worth a thousand words. Well, for investors and senior management of the companies, this chart is worth a million numbers. The quarterly time series reads across the top axis. The vertical axis reads off relative earnings productivity.

Goog_msft_rep_q105_q207_p01

Relative earnings productivity equals the ratio of actual to maximum earnings added to -1 (see the equation at the bottom left of this chart).  Why scale REP in this odd way? In order to depict a range from zero, where actual and maximum earnings are equal, to a very large negative number where actual earnings are far less than maximum earnings. The last observation in Google's REP schedule sends a clear message to investors. In the ten quarters following its IPO, Google management systematically guided the company to the point of nearly optimizing operating expenses and costs by the close of the 2nd quarter of 2007.

CLIMBING THE ATTRACTION CURVE
Oddly enough the calculation of relative earnings productivity using market share attraction theory assumes a strong linear relationship between sales revenues and company expenses.  This assumption sometimes is violated in financial accounting data, but it is quite easily tested with a scatter diagram. The following chart shows the relationship between Google's share of operating expenses and costs [SOC] on the horizontal [x] axis and its share of revenues [SOR] on the vertical [y] axis.

Goog_attraction_q105_q307_p01_2

Beginning with the quarter ending June 30, 2005 in the lower left-hand corner of the chart, Google incurred total operating expenses and costs of $909 million or 11.2% of both company's $8.081 billion total expenses and costs. Google generated $1.384 billion or 12.0% of $11.545 billion combined revenues. Now, 0.8% may not seem like much until you realize it represents an opportunity gain of over $65 million in expenses and costs of serving the market.

In the quarter ending September 30, 2007 in the upper right-hand corner the chart above, Google management captured 23.5% of the $17,993 billion in combined revenues, while incurring 27.1% of the $10.758 billion in combined expenses and costs. The difference between Google's SOR and SOC was -3.567 share points. The company incurred an opportunity loss of $383.8 million. There is a high (0.9) correlation between Google's share of revenues and share of costs. Only the two green markers in this chart are above the (implicit) 90 degree line of equal proportionality. The fitted trend line is unfavorable. As Google's share of revenues doubled from 12% to 24%, it became less efficient. Note the slope of the trend line is 0.8 (with an intercept of 3.0 share points). If revenues and costs were proportional the slope would be one.

SLIDING DOWN THE ATTRACTION CURVE
With only two companies in the analysis of market share attraction the result for Microsoft is a mirror image of that for Google. Beginning with the quarter ending June 30, 2005 in the upper right-hand corner of the following figure, Microsoft incurred $7.172 billion or 88.8% of the $8.081 billion combined operating expenses and costs of the two companies. At the same time Microsoft generated sales revenues of $10.161 billion, or 88.0% of combined revenues. As before, 0.8% may not seem line much until you realize it represents an opportunity loss of over $65 million.

Msft_attraction_q105_q307_p01_2

Turn the clock forward ten quarters and Microsoft's share of revenues fell to 76.5% while incurring 72.9% of combined expenses. The difference between Microsoft's SOR and SOC in September 2007 was +3.567 share points which produced an opportunity gain of $383.8 million. Only the two red markers are below the (implicit) line of equal proportionality. The trend is favorable. As MSFT's share of revenues dropped it became more efficient. As before, the slope of the fitted trend is 0.8. If revenues and costs were proportional the slope would be one.

EFFICIENCY vs. PRODUCTIVITY
Over the ten quarters Microsoft became significantly more efficient: its marginal cost per (revenue share) basis point fell from $6.8 to $4.4 million. But management failed systematically to improve on its relative earnings productivity. Google on the other hand became significantly less efficient: its marginal cost per basis point increased from $0.86 to $1.62 million. At the same time Google's management improved is earnings productivity – the difference between its actual and maximum potential earnings systematically increased from a -36% to -3%.

Last year in his online discussion of my book Chris Kenton said "You can be very efficient at doing the wrong things!" The corollary is "You can be inefficient at doing the right things." Perhaps "efficiency vs. productivity" and doing the "right and wrong things" revolve around sailing in a blue ocean vs. a red ocean, at least in this case.

NOT BUYING MY PREDICTIONS
Relative earnings productivity [REP] and risk-adjusted differentials [RAD] are two inputs to the competitive stock valuation model. My post on "Google vs. Microsoft: Blue/Red Ocean Stock Pricing" published by Seeking Alpha promoted another visitor to make this comment:

I'm not buying your predictions. There are too many other factors in play here. I guess we'll see in six months but I would be surprised to see MSFT under 40 in April and GOOG over 750. Maybe your models predict it, but I just don't see it. How often does this type of model accurately predict future value?

I too would be surprised! There are indeed "other factors" in play here and they are not hidden in a black box. They are right up front:

First, the competitive stock valuation model assumes that management will maximize earnings by optimizing operating costs. Google management has satisfied this requirement. Microsoft management has not. But Google might stumble and Microsoft might get it right.

Second, the model assumes that investors believe the company will create value in excess of costs over the long run. As Professor Rappaport put it in the quote above, the company will "... maximize long run productivity" or equivalently achieve "a sustainable competitive advantage." Google investors believe management will continue to maximize long run productivity. Microsoft investors do not. But these beliefs are fragile.

Can the results of competitive stock pricing be "safely extrapolated?" In a word, yes: but only in those cases where a company's relative earnings productivity and risk-adjusted differentials are opposite ...  in the extreme. On the one hand, when REPs are nearly zero at the same time that RADs are less than -2.0 over many periods, you might take a long position in the stock. On the other hand, when you find a company's REPs are less than -100 and RADs are greater than +2.0 over many periods, you might short the stock. Both instances represent serious mispricing. In my experience these extremes are rare ... fewer than 2 in every hundred companies.

THE TAKE-AWAYS
There are two take-aways from this reply to comments. If you have the time to find the outliers, combined with the money and risk propensity to invest in them, the competitive stock valuation model might make money for you. If you are Eric Schmidt or Steve Ballmer you might find the model identifies strategic challenges you have overlooked until now. And overcoming those challenges make make money for your shareholders.

Thanks for visiting.

~V