First the bad news: in 2006 alone GCI, DJ and TRB management under-invested in new media options to the tune of $2.3 billion. To put that number in perspective they actually spent $4.9 billion. If they had optimized they would have spent $7.2 billion. Only the New York Time Company (NYSE: NYT) came within a stone's throw.
Now the good news: two of the three underperformers will have new owners in December 2007. And by all accounts at least Mr. Murdoch, if not the others, will join Mr. Sulzberger as an owner with the digital committment to put his money where his mouth is.
BACKGROUND
This is the 4th post in my series on The Times and its peers. In the first post of this series, "The New York Times Co: Public Trust vs. Maximum Earnings," I found that, contrary to popular belief, over the ten years from 1997 through 2006 The Times managed to maximize earnings and at tne same time preserve its public trust as the newspaper of record. In the second post, "The New York Times Company: Enterprise Marketing and The Bottom Line," I concluded that Mr. Sulzberger could have it both ways. He could monetize the editorial content of the newspaper by charging for The Times Reader while keeping an even more interactive nytimes.com free of charge. By 2010 this strategy might double EBITDA as a percent of sales. Applying the last multiple to those earnings suggested a stock price of $87 in 2010. In the 3rd post, "The Rough Rider and The Gray Lady: Pennies for Dollars?," I concluded that:
If Mort Zukerman's conclusion is correct that he and other media owners including Arthur Sulzberger and Sam Zell are substituting pennies for dollars their combined market cap won't appreciate at all. In that case it looks like NYT will trade at around $28 in 2010. If the other three owners in this group manage to maximize earnings like the NYT did in 2006, together they can jump start all four members of this group into becoming profitable new media companies.
The purpose of this post is to document the systematic under-investment of these newspapers in their search to become new media companies. And assess its effect on revenues and earnings.
ENTERPRISE MARKETING EXPENSES
There's a huge difference between "micro marketing" and "enterprise marketing." The first is advertising and promotion expenses. The second is selling, general administrative expenses. Which includes advertising and promotion expenses, but also sales force, research and development as well all salaried employee expenses.
The SG&A expense category includes almost all the expenses that influence the customer experience. In marketing-speak, this is where the money behind every customer touch-point gets counted. Whether it’s the cost of an insert received with an invoice, or a phone conversation with a customer service rep, or the lead story in DealBook or MarketWatch covering something the CEO did or said. If you want to dig into the details on this topic check out my audio slide show "Enterprise Marketing Expenses."
THE BEST KEPT SECRET
Here's the best kept secret in financial management: the correlation between sales revenues and selling, general & administrative expenses for a large sample of companies is 0.96 with a standard deviation of 0.07. Which one causes the other really isn't relevant. Because sales and selling expenses move in lock step. There are few exceptions. And newspaper publishing is not one of them. This table reports the correlation coefficients for each company:
High correlations like this are why I call these enterprise marketing expenses: almost every line item in this account has the potential to influence how consumers, advertisers and investors perceive a company. As a result many of the expenses contribute to the creation of intangible assets that may one day end up on a company's balance sheet.
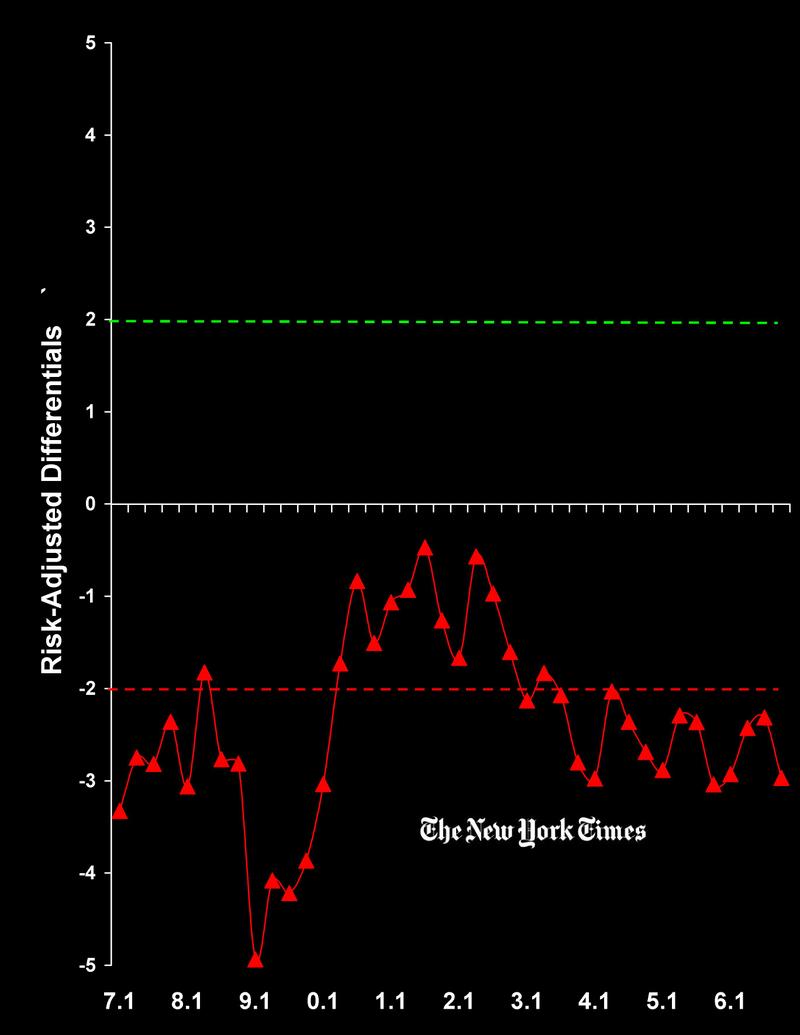
ENTERPRISE MARKETING EFFICIENCY
Here's something that's even more surprising. While sales revenues and enterprise marketing expenses move in lock step, some companies are far more efficient than others. I capture these differences with a metric I call the marketing efficiency ratio [MER]. This is the ratio of a company's actual spending to the level of spending necessary just to support its current market position.
On the one hand, if actual enterprise marketing expenses are greater than the theoretical level necessary to maintain current share of revenues, its EMR is greater than 1.0. In this event the company is spending more than necessary to maintain its current share of revenues. As a result it is relatively less efficient than its peers.
On the other hand if the EMR is less than one, the company is spending less than necessary to maintain its current share of revenues. In this event the company is relatively more efficient than its peers.
The New York Times is the most inefficient company in the group. Averaged over the decade, management spent 1.76 times more than necessary to maintain their share of revenues. Dow Jones is a close runner-up, spending 1.46 times more than necessary to maintain share of revenues. Gannett management was by far the most efficient, spending just one-half the amount theoretically required to maintain its share of revenues.
AN INTUITIVE TAKE ON MARKETING EFFICIENCY
Market share attraction [MSA] theory says that, on average, in a competitive market a company will attract revenues in direct proportion to the share of expenses incurred in serving that market. The popularity of this model is based on several characteristics: it's logically consistent; it derives from four simple axioms; its parameters can easily be estimated; and it seems to outperform both linear and multiplicative models.
Market share attraction theory also provides a more intuitive take on enterprise marketing efficiency. The result is portrayed in the following chart for the Tribune Company for 1997 through 2006. The vertical axis in this chart is TRB's share of revenues [SOR]. The horizontal axis is TRB's share of selling, general & administrative expenses [SOS].

Beginning with 1997 in the lower left-hand corner of the chart, TRB captured 21% of group revenues with a little over 20% of SG&A expenses. In all but two years TRB's share of group SG&A expenses tracks right along the diagonal dotted line. In short, the Tribune's data fit the theory almost perfectly: the company's SOS is proportional to its SOR. Corresponding intuitively with its mean marketing efficiency ratio of 1.0
A pattern similar to the Tribune's market share attraction exists for the other competitors. Except that in GCI's case the numbers track high high above the diagonal line of proportionality: its SOR is significantly greater than its SOS. Just as the New Yiork Times is far below, reflecting its enterprise marketing inefficiency.
An interesting investigation into the properties of the [MSA] model is available in the 2001 paper "Why is Five a Crowd in the Market Share Attraction Model: The Dynamic Stability of Competition" by Paul Farris and his coauthors. Their analysis assumes that firms maximize earnings by optimizing their own spending based on competitors' last-period budgets and the MSA model. Market share attraction theory is the engine that drives maximum earnings market share discussed in my book Competing for Customers and Capital.
A DECADE OF NEGLECT
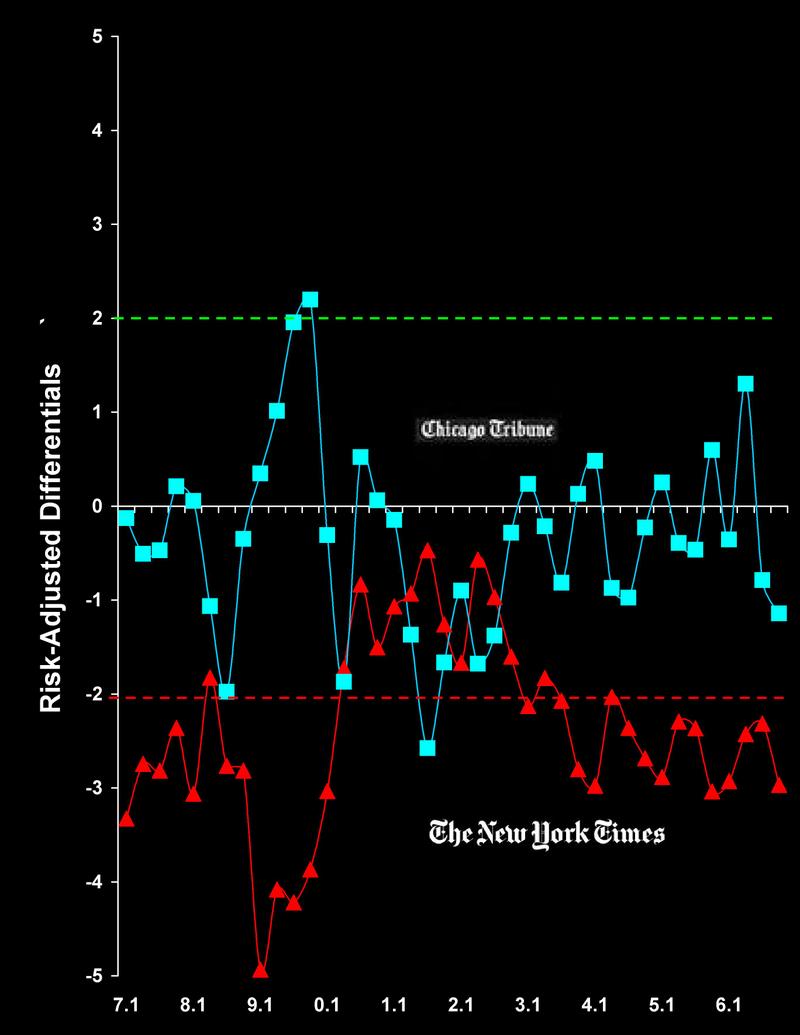
Perhaps the most important point of this story is the ten years of systematic under-investment by these four companies in their market. As the shift from old to new media progressed over the years from 1997 through the present, sales revenues of all four companies were far below their optimal level. The following table tells the story in a vivid four color image.
Actual cumulative sales revenues from 1997 through 2006 are reported for each company (by ticker symbol) and for the group in the first (blue) line of this table. Optimal cumulative sales revenues appear in the second (green) line of the table. The third (red) line is the difference between optimal and actual revenues.
The four companies actually generated a total of $161.5 billion in revenues. If all four companies had optimized revenues – spending up to the point that the earnings from the last dollar of revenues were equal to the SG&A expenses of producing it – group revenues would have been $238.7 billion. That's a short-fall of $77.2 billion, or nearly 50% of their potential.
Dow Jones was the worst offender in percentage terms generating actual revenues that were nearly 100% below optimal revenues. As Mr. Murdoch said in his pre-merger interview with Wall Street Journal reporters:
The Journal has had no money spent on marketing that I'm aware of for years. I imagine whatever we do would take the profit down in the short term… I mean of the Journal… It's got to have money put back into it, particularly on the digital side.
This conclusion is true of all four companies. Even the New York Times, which finally managed to optimize revenues in 2006, fell 38% short over the decade. And so did GCI and TRB where management continued the decade of neglect right through 2006.
How much money needs to be put back into Dow Jones? The following table provides a perspective on the magnitude of the challenge. The layout is the same as the previous table, except cumulative selling, general & administrative expenses – what I call "enterprise marketing expenses" – are reported here.

Over the decade management of the Dow Jones Company actually spent $6.64 billion on SG&A expenses. The optimal level of spending was more than double that number: $15.16 billion. Mr. Murdoch appears to understand the magnitude of the challenge he faces with Dow Jones. In his interview with Journal reporters he also said:
We've got to find new ways and new business models to get revenues. Or else the world is going to be owned by Google. I was asked at this investment thing I had to go to, what competitors I see I would have in five years time. Globally. I said I'm sure they'll be a lot of them. I know one is Google. It's just getting so strong, so powerful. And I know the guys, and like them. They're friends of mine. But it is a big fact of life.
TRB spent only one-quarter of its optimal SG&A over the decade. Perhaps this is why Sam Zell went motorcycle riding instead of attending the Tribune's first director's meeting. Maybe Mr. Zell didn't want to face the refrain of his highly leveraged buyout. In The New Yorker story on the "Rough Rider:"
His friend Stuart Sloan said that he has dropped out of Zell’s Angels because he feels that, at his age—he is sixty-four—it is too dangerous. But Zell, who skipped his first board meeting as a Tribune director last May to go on a Zell’s Angels trip in Switzerland, relishes the adventure and the all-male camaraderie.
The Gannett Co. was the second largest under-investor in this peer group. Over the decade the company spent just over $10 billion while it should have spent nearly $20 billion. Given this evidence one has to wonder if Craig DuBow has any idea of the costs associated with the ambitions he articulated in his December 5, 2007 press release:
Our overall corporate strategy ... is to build a robust digital business while supporting and enhancing our core. That digital business now is taking a clear and exciting shape. Here’s what I mean: Gannett has made dramatic changes in its operating structure, its newsrooms, its mindset and its culture in less than 18 months. We truly have become more nimble, innovative and customer-centric. Those changes are driving us as we implement a more focused digital strategy. The focus, simply put, is this: Gannett will become the digital destination for local news and information in all our markets. We will scale that content nationally whenever possible.
The Times suffered the least from neglect, spending "only" 52% below optimum over the decade. Does systematic under-spending depress earnings as well as sales? Of course. But, at this point the critical question is what management will do in future years.
YOU CAN'T COST-CUT YOUR WAY TO THE FUTURE
In this digital age shifting the source of our news from old to new media vehicles is a given. But the challenges lay only half way in the technological domain. Newspapers are now faced with a fierce global information market where the variety and number of competitors is unparalleled. The options are seemingly infinite and what one firm does effects the performance of all the others. This analysis doesn't tell management which options to choose. But it does measure the potential value of getting it right. And shows that newspaper owners can't cost-cut their way into their digital future. What do you think?
Thanks for visiting,
~V


