« April 2008 | Main | June 2008 »

May 2008

May 25, 2008

Straight From the Gut


In Straight From the Gut Jack Welch said “If you’re not #1 or #2, fix it, sell it or close it.” His quote captured the spirit behind the development of the Profit Impact of Marketing Strategy [PIMS] studies by the Marketing Science Institute under the direction of Professor Robert D. Buzzell in the early 1970s. These two works have led nearly every CEO since then to believe that more market share means more profit.

A LITTLE HISTORY
I was the Associate Research Director of MSI in Cambridge, MA in the spring of 1969 when Bob Buzzell cut a deal with Sidney Schoeffler to expand his original study of General Electric divisions on a massive scale. You could say that I was there when PIMS was born. I left for Chicago's GSB that summer.

The PIMS data were used in hundreds of papers published over the next two decades. The first was an HBR article on The Impact of Strategic Planning on Profit Performance by Sidney Schoeffler, Robert D. Buzzell, and Donald F. Heany. A comprehensive review of the entire body of work is available in the PIMS Principles by Bob Buzzell and Bradley Gale published in 1987.

In 1983 I began to study the financial statements of public companies hoping to uncover the “real” relationship between market share and profits. This work culminated in Competing for Customers and Capital published in 2006. That book provides the theoretical underpinnings for these posts. One of the dominant principles is managing market share to optimize earnings. You can get a quick overview of this principle in my audio slide show The Role of Maximum Earnings.

In a nutshell, more market share is a good thing only up to a point. After a company reaches that point, profits begin to decline -- because the cost of the next share point suddenly exceeds it value. Where “that point” occurs depends on a host of things. And it may occur at a very low or a very high market share. But sooner or later that point will be reached.

AIR EXPRESS WARS
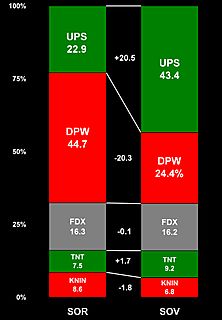
In my last post I discussed air express carrier share in relation to their markets for customers as well its equally important relation to the market for capital. The metric I used was the value-sales differential – the difference between each company’s share of value in stock markets and its share of revenue in service markets. For an overview of the theory and properties of this metric see my audio slide show Y'All Buckle That Seatbelt. I concluded the post with these four questions:

  1. How is UPS able to outperform its peers?
  2. Why the disappointing results from DHL?
  3. What left FDX sitting on the bench?
  4. How can TNT and KNIN move ahead?

One way to explore answers these questions is to consider the degree to which each company managed market share to optimize earnings.

MAXIMUM EARNINGS MARKET SHARE
The following chart shows actual and optimal market shares for each of the five leading air express carriers: Kuhne+Nagel (SWX: KNIN); TNT (AEX: TNT); FedEx (NYSE: FDX); United Postal Service (NYSE: UPS); and DHL (XET: DPW).

5 Express Carriers MEMS 2007

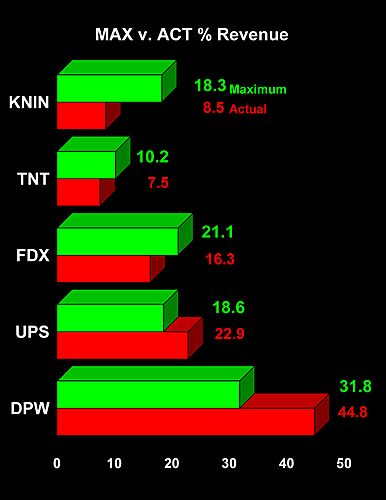
  • DPW turned in the worst performance of the group. Its maximum earnings market share (31.8%) was a full 13 points less than its actual share (44.8%) of revenues. 
  • UPS turned in a much better relative performance with a maximum earnings share of 18.6% compared with actual share of 22.9%.
  • FDX, TNT and KNIN all posted actual shares of revenue that were significantly less than their maximum earnings shares.

OPTIMAL SALES
In ExecEd sessions most CEOs find it a fascinating theoretical exercise to discuss the pros and cons of maximum earnings market share. To them the concept even makes great cocktail party conversation. But when you translate those share numbers into sales revenues the sparks begin to fly!

Take the following chart of optimal sales revenues for the top five air express carriers as a case in point. Notice that the combined sales of these companies are close to optimal levels. Actual group sales were $216.8 billion while optimal sales were $228.3 billion. Optimal sales were only 5% greater than actual sales. This is an extraordinary accomplishment for such a complex global industry.

5 Express Carriers Optimal Sales 2007

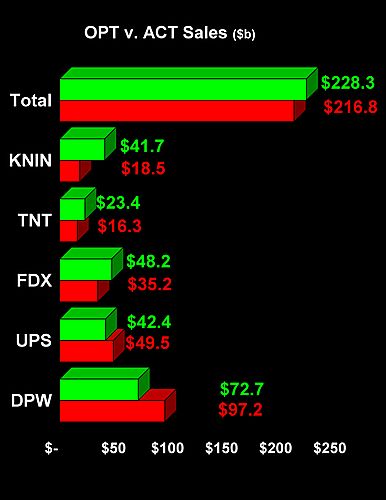
But would you dare tell Dr. Frank Appel that he should plan a sales cut from $97.2 billion to $72.7 billion -- by $24.5 billion USD -- in order to maximize earnings? Would any CEO willingly harvest that many sales for earnings? Sadly, that's what the senior managers of many legacy air passenger carriers are faced with in today’s market.

It might be easier to convince Frederick W. Smith chairman, president and chief executive officer of FDX that he should plan to increase sales from $35.2 to $48.2 billion – about $13 billion – either buy organic growth or through acquisitions.

What do you think Klaus Herms the CEO of KNIN would think about the prospect of increasing sales by 56% from $18.5 to $41.7 billion USD?

OPTIMAL COSTS
Of course all of the strategic recommendations that follow from maximum earnings market share have a dramatic impact on costs. The theoretical results are reported in the following chart.

As you might expect, given the close proximity of optimal to actual group revenues, their combined total operating costs at actual and optimal levels are almost exactly the same – separated by only 1.3% or $2.2 billion USD.

5 Express Carriers Optimal Costs 2007

But, again, the picture is very different for DPW. Its optimal operating costs of $48.3 billion were over 62% less than its actual 2007 operating costs of $77.9 billion USD. Even UPS was over-spending in the amount of $7.5 billion or 22%.

FDX was under-spending by $12.1 billion (32%); TNT under-spent by $6.8 billion (33%); and KNIN under-spent by $20.5 billion, or nearly 61%.

OPTIMAL EARNINGS
All of the above brings us to the bottom line – earnings after total operating expenses [EBITD]. The following chart tells the story of actual vs. optimal earnings for each company and the group.

Combined optimal earnings ($53.9 billion) of the five companies were $9.2 billion USD, or 17%, greater than actual earnings of $44.7 billion. The majority of that was accounted for by DPW’s $5.0 billion short-fall.

5 Express Carriers EBITD 2007

The company with the most to gain is KNIN. If the company invested in demand to the point that its revenues were optimized it theoretically would increase earnings by 34% from $5.3 to $8.0 billion USD.

COULD IT BE?
If the Chairman of the biggest company in this group might not listen, why bother? Here’s how I look at it. I am writing to plant one seed here and another one there. Hopefully these seeds will grow and eventually a senior manager will listen and consider taking the recommended course of action. Either out of curiosity, when the potential gains are worth the risk. Or out of necessity, when they have no choice. And it really doesn’t matter what the motivation is so long as steps are taken in the right direction.

By the way, could it be that the value-sales differential of UPS was +20 points while that of DPW was -20 points partly because its actual earnings were five times closer to optimal than were DPW’s?

Thank you for visiting. As always your comments are welcome.

~V

May 18, 2008

The New Meaning of Market Share

Why is market share of revenues a strategic benchmark while market share of value is not even measured? There are several possibilities. Make a mental check of the following reasons that apply to your answer to this question:

_____ Market value is a financial metric
_____ Market share is a marketing metric
_____ Market value is too volatile
_____ Stock markets are efficient
_____ I haven't thought of it before
_____ All of the above.

Chances are you checked several if not all of the above. That’s why I decided to begin this new series. For the next few posts the goal will be to compare the performance of the top international air express carriers with the fundamental metrics introduced in my book Competing for Customers and Capital -- beginning with the new meaning of market share. Why look at air express wars? Because the results are both timely and unexpected.

AIR EXPRESS CARRIERS
In its 2007 annual report Deutsche Post World Net listed four companies in its peer group: “TNT, FedEx, UPS and Kuhne+Nagel.” You may have not seen these five companies on the same page before, because three of them are less known in the U.S.

Deutsche Post is listed on the Frankfurt exchange (XET: DPW) In the U.S. we know the company as DHL (which stands for the last names of its founders: Adrian Dalsey, Larry Hillblom and Robert Lynn). TNT is a Dutch company listed on the Amsterdam Stock Exchange (AEX: TNT), while Kuhne+Nagel is a German company listed on the Swiss Exchange (SWX: KNIN).

VALUE vs. REVENUE
The financial metric that links sales revenues to market capitalization is the value/revenue [v/r] multiple. It is a revealing metric. All the more so to me since I found the long-run expectation for the v/r ratio from 1950 through 2005 is nearly equal to 1:

The sum of market values over the 56 years was $244,850 billion USD. The sum of sales revenues over the period was $222,805 billion. The long run VR ratio was 1.10.

If you’re interested in the details see The Value/Revenue Ratio: A Semi-Long-Wave Marketing/Accounting Metric.

The following table reports sales revenues and market value for the top five international air express carriers and for the group as a whole in 2007. This is not a picture of a high-value industry. Without their indexed fuel surcharges the performance of these companies might look a lot more like air passenger cariers.

Five_shipper_data_2007

United Parcel Services (NYSE: UPS) is the only company in this table with a value/revenue ratio greater than one. For the group as a whole that ratio was just under 0.80. As revealing as these data are there is a more powerful metric for assessing the relationship between market value and sales revenue.

VALUE-SALES DIFFERENTIALS
The value-sales differential [VSD] is the difference between a company’s share of value [SOV] and share of revenue [SOR] in a peer group. Here's the critical distinction between the v/r ratio and the value-sales differential.  The v/r ratio is a meaningful metric with regard to the company as a stand-alone enterprise.  The VS differential is a meaningful metric with regard to the company as a member of a peer group. The two are not highly correlated.

The sum of value-sales differences across a sample of companies in the same time period is zero.  That's because it’s based on the difference between two numbers in sets that all sum to 100.  No matter how large or small the differential is for any given company, the sum of the differences for a cross-section of companies always will be zero.

In short, the value-sales differential is an interval scaled (whole numbered) index of a firm’s tangible and intangible market value relative to its peers. If you want a quick overview of the theory behind (and properties of) the VSD you’ll find one in my audio slide show Y’all Buckle That Seat Belt. If you’re interested in the details behind this metric you can download my MSI paper Marketing’s Impact on Firm Value or buy my book.

AIR EXPRESS DIFFERENTIALS
The following chart reports the share of revenue [SOR] in the left-hand bar and share of value [SOV] in the right-hand bar for the top five air express carrierss in 2007. The value-sales differentials appear between the bars with plus or minus signs. The green bars represent those companies where SOV is greater than their SOR. The red bars are for those companies where SOR is greater than SOV. The numbers in this chart were calculated from the data in the table above.

Five Shipper VSD 2007  


Investors awarded UPS with +20.5 point differential advantage over its peers: the company captured only 22.9% of the revenues and created 43.4% of the shareholder value in the group. The value created by UPS management was nearly double its sales churn.

Investors punished DPW with a -20.3 point disadvantage: the company generated 44.7% of the revenue but created only 24.4% of the value in this group. The sales churn generated by DPW management was almost double its value creation.

Meanwhile, FedEx (NYSE: FDX) was neither rewarded nor punished by investors: management generated 16.3% of the revenue and created 16.2% of the value. FDX sits on the sidelines. TNT was awarded a small premium while Kuhne+Nagel was discounted to a similar degree.

THE NEW MEANING OF MARKET SHARE
Market share is not just a marketing metric. It measures performance in both the sales generation and value creation domains. And the two interact in subtle but revealing ways. Here are some of the questions raised by the analysis of value-sales differentials in the air express carrier market:

1. How is UPS able to outperform its peers?
2. Why the disappointing results from DHL?
3. What left FDX sitting on the bench?
4. How can TNT and KNIN move ahead?

If you're not interested in the air express wars you might want to see how companies in which you own stock stack up against their peers. The calculations are simple. The implications may be more challenging.

Thanks for visiting. As always your comments are welcome.

~V

May 11, 2008

Charting a Demand Curve

In its 10-K filing (page 33) Amazon.com (NASDAQGS: AMZN) reported spending $1,174 million on outbound shipping in 2007. That amounted to 7.9% of revenues. The good news is Mr. Bezos also earned $740 million on those outbound shipments, a lot of it from the Amazon Prime Club annual membership dues.

A LITTLE BACKGROUND
In the ninth of this series in my ten posts on airline mergers, Passengers, Packages: The Paradox of Air Transport, I reported that FedEx (NYSE: FDX) and UPS (NYSE: UPS) had Michigan ACSI customer satisfaction scores around 80% in each of the last ten years. In the same period American Airlines (NYSE: AMR) and United Airlines (NasdaqGS: UAUA) barely broke the 60% customer satisfaction barrier. Claes Fornell and his colleagues have shown that higher ACSI consumer satisfaction scores are associated with high returns and low risk. Prompted by these results I asked:

Wouldn’t it improve consumer satisfaction if passenger airlines took baggage out of their equation? And specialized in transporting passengers? In economics this is called the “division of labor.”

In his Enquiry into the Nature and Causes of the Wealth of Nations Adam Smith wrote in the first paragraph of Book 1, Chapter 1:

The greatest improvement in the productive powers of labour, and the greater part of the skill, dexterity, and judgment with which it is any where directed, or applied, seem to have been the effects of the division of labour.

You may think taking luggage handling out of the passenger carriers’ operational equation is great idea, or you may think it’s ridiculous. Either way you will agree it can’t happen unless express shipping can affordably be married to airline reservation systems. The purpose of this post is to chart a demand curve for express luggage services without any historical data. In doing so I hope to suggest the impact specialization might have on the price of express shipping services.

THE VOID IN PRICING DECISIONS
Price elasticity may be the most widely taught yet little used concept in marketing science.  As evidence, price elasticity is not even mentioned in the text of two classic pricing cases involving radical innovations: digital cameras and deregulated airlines.  The reason is not a failure of the underlying theory (see Chapter 10 of Lilien and Rangaswamy’s Marketing Engineering). Rather it’s due to the inability of management to connect price theory to the market realities of new product introductions.

The demand for brand new consumer products depends heavily on their price.  Digital camera demand is a contemporary example of this dependence. Here's what Gary DiCamillo, CEO of Polaroid had to say about digital imaging in 1997:

... the consumer market will be slower to evolve.  I don't think we'll see something major next year or the year after or maybe even by the year 2000…Will it become a big deal?  I don't know…I think there's revenue there, but I'm not sure about profit (Polaroid Corp., Rosenbloom and Pruyne 1997).

The uncertainty expressed in by Polaroid's CEO was based partly on the difficulty of articulating the relationship between price and consumer demand. Implicit in the CEO's statement "… I'm not sure we can make a profit… " is the tradeoff between increases in sales volume associated with decreases in price.

Perhaps more directly related to charting the demand curve for express luggage shipping is this comment by Rollin King, EVP of a startup called Southwest Airlines (NYSE: LUV):

Pick a price at which you can break even with a reasonable load factor… a load factor that you have a reasonable expectation of being able to get … without leading yourself down the primrose path and running out of money (Southwest Airlines, Lovelock 1975).

I’ll bet both Mr. DiCamillo and Mr. King had economics 101 in college. So why wasn’t price elasticity used in their assessment of demand for their innovations? Because there’s a huge knowledge void between drawing demand curves on a blackboard and estimating price elasticity in practice. Drawing demand curves is an art. Estimating price elasticity is a science. The folks at the airline carriers who are responsible for seat-specific pricing use a vast amount of historical data to price those seats in a way that optimizes revenues. Yet given less complete (and less applicable data) one can still make predictions about possible express luggage pricing.

LIMITED INFORMATION DEMAND CURVE
There are no data on what the large scale demand curve for express shipping of luggage might be if it were adopted by passenger carriers. But it’s possible to craft one without such data from the limited bits of information currently available. How? Begin by bracketing the limits of what demand might be. I identified the lower limit in my last post:

I ordered a new HP Laser Jet P2015 printer from Amazon.com The retail price was $449. I paid just $289.99. The next-day Amazon Prime delivery charge for this 28.9 pound package on UPS was $3.99. Based on this rate significant scale economies must exist in AMZN’s agreement with UPS as a result of huge shipping volumes.

One reader complained that I “conveniently neglected” to mention that Amazon Prime membership cost $79 a year. Actually, I didn’t neglect to mention this, I simply forgot how much it cost and didn't bother to look it up. In case you’re not a member here’s what Amazon Prime membership gets you:

Overnight Shipping for only $3.99 per item
-- order as late as 6:30 PM ET
Ship to any eligible address in the contiguous United States

I think you will agree that $3.99 for shipping a 30 pound package from Dallas to New Orleans next-day air is likely the lower limit that Amazon would pay for this service.

It’s just as easy to get the upper limit. Using the UPS shipping screen I priced a 30 lb box from New Orleans to Dallas standard overnight express at $142.50. I joined UPS online shipping to get this number, so it is the rack rate for a single shipment.

I also need a few points in between the upper and lower limits. The first two points I got from the logistics manager of a company that does $500,000 in UPS shipping services per year. He pays $89.64 to overnight a 30 lb package from New Orleans to Dallas. That’s a base rate of $73.20, plus a declared value charge of $1.80, plus a fuel surcharge of $14.64.

I also got an estimate of $42.75 for that same overnight package from another shipper that books a little over $1.5 million a year with UPS. Scaling that number back to $1 million per year gives a price of about $56. If these last two prices are representative it's likely when a shipper doubles annual volume from $500,000 to $1,000,000 they earn a 37% discount. So I ran this discount assumption up the scale doubling volume each time till it got close to that $3.99 AMZN cost. That happened at $64 million per year in annual shipping volume.

CHARTING A DEMAND CURVE
Because of its restrictive properties the constant elasticity demand curve works better than the linear demand curve in this context. It’s expressed as a power function in the following chart.

Ups_cost_function_5808_p01

In this function annual shipping volume [q$] equals a constant [a] multiplied by the price to ship a 30 lb. package from New Orleans to Dallas [P] raised to the power beta, which is the constant elasticity of demand over the range of the function. Extrapolating this equation using the limited information described above creates the demand curve in this chart.

Based on the limited information and assumptions behind this chart, AMZN would reach a net per package rate of $3.53 at an annual shipping volume of $64 million. Note from the opening paragraph in this post that Amazon had a net outbound shipping volume of $434 million in 2007. It just may be that Mr. Bezos pays even less, on average, than $3.53 for that nationwide shipping rate! Only he knows for sure.

Remember there are no data on shipping luggage in the volumes that would occur if baggage were moved from the passenger transport into the package transport system. Such a move probably would create tonnages well beyond the current capacity of even the largest express shipper (DHL revenues are 50% greater than UPS).  If this chart is indicative of that future, demand is highly price elastic: beta is -1.5.

THIS AIN’T TEA LEAVES
In pricing a new product or service it’s necessary to imagine a future that cannot be projected from the past. Charting demand curves from limited information brings the power of theory to bear on the relationship between price and volume. As Peter Drucker famously said “The only way to predict the future is to create it.” But before you can create it you must imagine what it looks like. Isn't that what theory is designed to do?

Thanks for visiting. As always, your comments are welcome.

~V