Microsoft

February 03, 2008

Steve, Why Shell Out $45 Billion?

Since last Friday the Internet has been abuzz with analysts’ reactions to Steve Ballmer’s letter to the Yahoo! board (NasdaqGS: YHOO) asking for quick approval of a buyout at $31 a share in cash or Microsoft stock (NasdaqGS: MSFT).

A broad sampling of these reactions was provided by Dan Gallagher in his MarketWatch technology column “Microsoft-Yahoo deal draws mixed reactions.” No fewer than nine analysts from seven companies weighed in on the deal just hours after it went public. They split about evenly between pro and con. One of those reactions struck me as speaking to the heart of the matter on two critical dimensions: synergies and integration (the emphsis is my own).

Although the synergies between the two companies, which Microsoft asserts are worth at least $1 billion a year, are certainly great, the merger also raises the question of how effectively they'll be able to continue operating during their integration. The online-advertising business requires significant levels of account service and even the perception of a diversion could wind up delivering business to their competitors. -- Andrew Frank, research vice president at Gartner Inc.

I’m not qualified to speak to the integration issue, which largely is a technical question, but I am able to speak to one important dimension of synergy. As Mr. Ballmer put it in his letter to the Yahoo! board "eliminating redundant infrastructure" inherent in the merged companies. The purpose of this article is to document the sources of competitive redundancies based on the latest financial accounting data.

18.8¢ AIN’T A HECK OF A LOT
18.8¢ does not seam like much until you realize it was at one time the difference between Microsoft and Google’s (NasdaqGS: GOOG) cost per dollar of revenue. On April 17, 2007 I posted an article “Microsoft’s $8 Billion Problem.” In that piece I concluded that:

It cost Microsoft 18.8¢ more to generate a dollar in sales than it cost Google. Multiply that 18.8¢ times its sales revenues and you find that Microsoft has an $8.3 billion dollar problem. That's how much the company was over-spending on enterprise marketing in 2006 compared with Google.

In that same article I introduced “Gerstner’s Rule.” In his book Who Says Elephants Can't Dance? Lou Gerstner laid out a rule of thumb on enterprise marketing efficiency. It's simple and revealing: How much does it cost to generate a dollar in sales revenue compared with your competitors? This is Gerstner's cost per dollar [CPD] rule: less is more. If you’re interested in how much CPD varies among companies see my May 11, 2007 article “Gerstner’s Rule in High Tech Industries.”

INSIDE ENTERPRISE MARKETING
There’s a huge difference between enterprise Marketing, with a big M, and traditional marketing. In an audio slide show I define Enterprise Marketing Expenses as …

… all the costs of the people and programs that influence how consumers, customers and investors think, act and feel about a company.

Fortunately the income statements of MSFT, YHOO and GOOG give us a pretty clear picture of all those expenses. The following table reports all the costs found inside the enterprise marketing expense [EME] category: Selling & Marketing [S&M], General & Administrative [G&A], and Research & Development [R&D]. These line items accounted for 53%, 16%, and 32% of MSFT’s total enterprise marketing expenses, respectively.

1_basic_data_mr_4_qts

I colored EME a cautionary yellow because earnings occur only after all three expenses are covered. And I colored S&M expenses red because they often are the culprits in a company’s failure to maximize earnings. By the way, the approximately $12 billion that Microsoft spent on S&M included traditional marketing as well as sales force expenses. These data were downloaded from Edgar Online I*Metrix services. For MSFT and GOOG the most recent 4 quarters ended in December 2007, while YHOO’s ended in September 2007.

GERSTNER’S RULE
The basic data make a lot more sense when standardized using Gerstner’s Rule: in enterprise marketing less is more. The next table reports the cost per dollar [CPD] of revenues by source for each company.

2_cpd_by_source_mr_4_qts

Microsoft’s gross CPD (in the right-hand column) was $0.40 in December 2007. This compared with $0.46 in June 2006 (not shown). This represents a decline in Mr. Ballmer’s CPD of nearly 12% in 18 months. On the other hand YHOO’s cost per dollar increased 8% from $0.42 in June 2006 (not shown) to $0.45 in December 2007; while GOOG’s went from $0.27 to $0.29. But G&A expenses as well as R&D expenses per dollar sales were comparable across all three companies. It’s Sales & Marketing expenses that raise the red flags for MSFT and YHOO.

IT’S SELLING & MARKETING EXPENSES!
The next table reports the cost per dollar for MSFT and YHOO net of GOOG’s cost per dollar by source. Notice MSFT posts a net competitive advantage on G&A expenses as well as R&D costs per dollar revenue.

3_net_cpd_by_source_mr_4_qts

Still there’s a bothersome -12¢ CPD in net Selling & Marketing expenses. Not to mention YHOO’s net CPD disadvantage of -16¢, most of which is also attributable to Selling & Marketing expenses.

THE PAJAMA GAME
This final table brings the analysis back to the central question: What are the potential synergies to be found in this merger of equal over-spenders? Like Eddie Foy, Jr. sang in the 1954 hit Broadway play The Pajama Game, 11¢ doesn't buy a hell of a lot ...

4_net_redundancies_mr_4_qts_2

… till you multiple it by MSFT’s nearly $58 billion 2007 revenues. That produces an eye-popping net competitive redundancy of $6.367 billion … all of which is associated with MSFT’s Selling & Marketing expenses. To be sure that’s nearly $2 billion less than the $8.3 billion dollar competitive redundancy from 2006 mentioned above. A big improvement, but this just begs the original question.

WHY SHELL OUT $45 BILLION?
Dan Gallagher’s MarketWatch technology column “Microsoft-Yahoo deal draws mixed reactions” also quoted Leland Westerfield as saying:

Microsoft would ultimately need to sweeten its initial offer price …
(BMO Capital Markets)

Why shell out $45 billion or sweeten the deal more for a house in the country – pardon the garish play on words - when the goal should be to fix a problem in Mr. Ballmer’s own back yard? What do you think?

Thanks for visiting. As always your comments are welcome.

~V

May 04, 2007

Microsoft Reboot!

In my post on Microsoft’s $8 Billion Problem I suggested that Double-Click might offer a solution to its sagging value/revenue multiple – 6 compared with Google’s 14. But, I didn’t take the Yahoo option seriously until this morning when Andrew Ross Sorkin contributed the following to a Deal Book report in the New York Times:

Microsoft has made a preliminary overture to Internet giant Yahoo, and the two companies are in very early discussions about a possible merger, according to people briefed on the discussions.

Then this moring Henry Blodget asked (and answered) these questions in his blog:

Would it be a smart strategic move for Microsoft and Yahoo to combine forces? Absolutely. Is the best way to do this to have Microsoft suck into the massive Windows/Office empire? Absolutely not. If Microsoft buys Yahoo, Microsoft should immediately spin the Yahoo-MSN business out as a separate company. If it doesn't, both Yahoo and MSN will die.

Given the pre-market pop in Yahoo’s shares others apparently are taking this report seriously too.

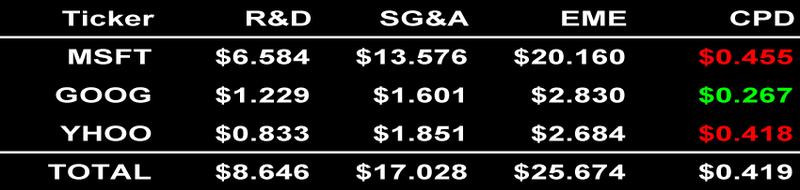
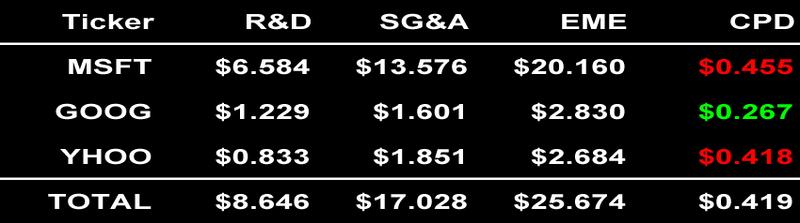
So, this brings me back to Microsoft’s $8 billion dollar problem. That problem is based on the company’s enterprise marketing efficiency compared with that of Google.

Gerstner's cost per dollar (CPD) rule is simple and revealing: how much does it cost MSFT to generate a dollar in sales revenue compared with Yahoo and Google? It's one of two measures of enterprise marketing efficiency I use in my audio slide show on The Battle for Your Desktop.

In 2006 it cost MSFT $0.46 to generate a dollar in revenue, compared with Google’s $0.27 per dollar in revenue. This is Microsoft’s $8.4 billion problem [$44.3*(0.46-0.27)]. How about Yahoo? It cost them $0.42 per dollar. So Yahoo has a $1 billion dollar problem compared with Google [$6.4*(0.42-0.27)].

Do you think combining the two and creating a $9 billion problem will help much? Even if Yahoo-MSN is spun off as Henry recommends? In the history of financial markets has it ever really helped for two companies suffering from the same symptoms to join forces?

~V

April 18, 2007

Goliath and the Three Davids

In his comment on Microsoft's $8 billion problem Jonathan Knowles suggested that I run the enterprise marketing efficiency (EME) numbers on all public companies. I've been working with Gerstner's "Cost per Dollar Sales" for years and it never occurred to me to do a large sample study of this metric. It's so easy to lose sight of the forest for the trees!

In the meantime I went back to my analysis of The Battle for Your Desktop and pulled up a table on the EME ratios for IBM and three of its troublesome little competitors beginning in 1991.

GOLIATH AND THE THREE DAVIDS
In 1991, a couple of years before Lou Gerstner took the helm, IBM's sales were $64.8 billion and its enterprise marketing (SG&A) expenses were $28.0 billion. It cost the company 43¢ to generate a dollar of sales. Hummm, somehow IBM's enterprise marketing efficiency (the first red column in this table) is troublingly close to Microsoft's cost of 45.5¢ per dollar sales in 2006 (see my last post Stuck in a Rut). Here's the data for IBM and the three Davids over the decade:


Me_ibm_cpq_hpq_dell_p01_3

Gerstner and his team were able to drive IBM's enterprise marketing (in)efficiency down to 24¢ by 2000. Which in its own right was extraordinary. Even so IBM never could catch up with Compaq (CPQ), Hewlett-Packard (HPQ) and Dell (DELL). These three Davids didn't amount to much in 1991 with sales of just over $18 billion. But their enterprise marketing expense per dollar sales (the second red column in this table) was only 35¢ in that year and fell to 17¢ by 2000!

ENTERPRISE MARKET SHARES
You can easily calculate from the sales data in this table what happened to IBM's enterprise market share over the last decade of the 20th century. It fell from 78% in 1991 to 43% in 2000. And we know what happened to the market caps of the three Davids during the decade.

In 2006 Microsoft's sales were $44.3 billion. Google and Yahoo! together generated sales of $17.0 billion. Microsoft's market sahre was 72%. Is it destined to become the IBM of the 21st century? I guess that depends on whether or not Microsoft can fix it's $8 billion dollar problem. Before it gets to be an even bigger one.

~V

April 16, 2007

Stuck in a Rut

In enterprise marketing two markets are always in play: the markets for customers and capital. And we know they interact. Increased sales revenues feed back on market valuation with the promise of greater cash flow. And higher a market valuation feeds back on revenues by providing cash for growth through acquisitions.

Vr_ratio_msft_goog_yhoo_41707_p01_2

This table shows the un-level playing field for three search/ad space companies and the group's total. Using the 2006 data in Yahoo! Finance they generated $61.3 billion in revenues and created $469.5 billion in market value. This led to a value/revenue (v/r) ratio of 7.66 for the three companies combined. Overall they created $7.66 in market value for every dollar of sales revenue.

THE VALUE/REVENUE RATIO
In my study of The Value/Revenue Ratio of all public firms from 1950 through 2005 I found the average to be 1.1 which means long-run revenues and market cap are about equal. The standard deviation in the v/r ratio increased systematically from 1.2 in the decade of the 1950s to over 70 in the volatile period from 2000 to 2005. In the the1991-1999 sample of 50,472 firms the standard deviation in the v/r ratio was 7.92. So the combined performance of this Internet group in 2006 was rather modest.

STUCK IN A RUT
Notice in the table above that Microsoft generated only $6.31 in value for each dollar of sales, while Google generated $13.83 in market value for every dollar of sales. Microsoft's value/revenue ratio is just like another major player in software and servers: in 2006 Oracle's was 6.97.  The gaming segment accounted for about 10% of Microsoft's revenues. Nintendo, a stand alone competitor with similar gaming revenues, had a v/r ratio of 4.50 in 2006. Microsoft is stuck in a rut they want to get out of. That's why Redmond saw DoubleClick as part of the solution to its $8 billion problem.

GERSTNER'S RULE
The first thing we need to know in order to understand what's driving these value/revenue results is the enterprise marketing efficiency for each player. Lou Gerstner, in his book Who Says Elephants Can't Dance?, laid out a rule of thumb on enterprise marketing efficiency. It's simple and revealing: how much does it cost to generate a dollar in sales revenue compared with your competitors? This is Gerstner's cost per dollar (CPD) rule. It's one of two measures of enterprise marketing efficiency I use in my analysis of The Battle for Your Desktop.

REDMOND, YOU HAVE A PROBLEM
Enterprise Marketing Expenses (EME) are all the costs of the people and programs that influence how customers and investors think, act and feel about a company.

Cpd_msft_goog_yhoo_41707_p013_2

In 2006 Microsoft spent $6.584 billion on R&D, plus an additional $13.576 billion on Selling, General and Administrative expenses (which include their traditional marketing and sales force expenses). So, the company's total bill for enterprise marketing came to $20.160 billion. Divide this total into the company's sales from the first table to calculate its CPD: it cost Microsoft 45.5¢ to generate one dollar in sales in 2006.

Google spent $1.229 billion on R&D, plus another $1.601 billion on Selling, General and Administrative expenses for a total enterprise marketing expenditure of $2.830 billion. So, Google's CPD was just 26.7¢.

IT ADDS UP TO $8 BILLION
It cost Microsoft 18.8¢ more to generate a dollar in sales than it cost Google. Multiply that 18.8¢ times its sales revenues and you find that Microsoft has an $8.3 billion dollar problem. That's how much the company was over-spending on enterprise marketing in 2006 compared with Google. Increased sales revenue feeds back on market valuation with the promise of greater future cash flow. And increased market valuation feeds back on revenues by providing more cash for acquisitions. Microsoft's overspending problem might have been solved by the acquisition of DoubleClick. But Google took that prize away.

SOUR GRAPES
This morning the TimesOnline reported that "Microsoft matched Google’s $3.1 billion (£1.56 billion) bid for DoubleClick but was snubbed by the largest independent broker of online display advertising." Support for this report appeared in the form of a call by Microsoft's:

Bradford L. Smith, Microsoft’s general counsel, told The New York Times an interview Sunday that Google’s purchase of DoubleClick would combine the two largest online advertising distributors and thus “substantially reduce competition in the advertising market on the Web.”

Sure sounds like sour grapes coming from the general counsel of a company that spent years fighting an anti-trust suit. And a legal battle will just magnify Microsofts problem.

WHAT'S NEXT?
Are there other acquisition targets out there that might help Redmond solve its $8 billion dollar problem?

~V

April 09, 2007

Double Your Money?

THE BUZZ
The wires were abuzz last week with the Wall Street Journal report that Google had joined Microsoft in the race to buy DoubleClick. We know that DoubleClick is majority-owned by San Francisco private-equity firm Hellman & Friedman and they have hired Morgan Stanley to find a buyer for it at $2 billion. We also know from the Journal's report that Time Warner's AOL unit and Newscorp are customers of DoubleClick. Yahoo! also has talked acquisition with the company.

AN INSIDE VIEW
You can be sure that senior managers of all these companies, as well as their board members and investment bankers are discussing the pros and cons as well as running the numbers on DoubleClick right now.

I wondered if this acquisition was in Microsoft's best interests, so I went searching for DoubleClick's 2006 revenues and found Don Dodge's web log. Don is currently Director of Business Development for Microsoft's Emerging Business Team. Here's what he thinks about the acquisition:

DoubleClick could be a good strategic fit for Microsoft's AdCenter and online business. At some price it makes sense. The numbers have to work. Heck, Microsoft can even overpay a little and make it work in the long run. But, at $2 billion...I would pass.

AN OUTSIDE VIEW
But Larry Dignan, Executive Editor of ZDNet news and blogs thinks the acquisition is a good idea:

It's unclear whether Microsoft would pull the trigger on a big deal, but it may add up. Consider the options for Microsoft. It could buy Yahoo in an expensive deal. It could continue to invest in online services that aren't getting traction. Or it could take the middle ground, which would be acquiring DoubleClick.

Given these conflicting views, I decided to run some basic enterprise marketing numbers on the three main players in this game: Microsoft, Google and Yahoo! The results are surprising.

TWO MARKETS
In the enterprise marketing framework two markets are always in play: the markets for customers and capital. And we know they interact. Increased revenues feed back on market valuation with the promise of increased cash flow. And higher market valuations feed back on revenues by providing cash for aquisitions.

Vr_ratio_msft_goog_yhoo_41707_p011

This table shows the un-level playing field for the three companies and the group totals. Using the 2006 data in Yahoo! Finance the companies generated a total of $61.3 billion in revenues and created $469.5 billion in market value. This led to a value/revenue (v/r) ratio of 7.66 for the three combined. Overall they created $7.66 in market value for every dollar of sales revenue.

THE VALUE/REVENUE RATIO
In my study of The Value/Revenue Ratio of all public firms from 1950 through 2005 I found the average to be 1.1 which means in the long-run revenues and market cap are about equal. The standard deviation in the v/r ratio increased systematically from 1.2 in the decade of the 1950s to over 70 in the volatile period from 2000 to 2005. In the the1991-1999 sample of 50,472 firms the standard deviation in the v/r ratio was 7.92. So the combined performance of this Internet group in 2006 was rather modest.

STUCK IN A RUT?
Notice in the table above that Microsoft generated only $6.31 in value for each dollar of sales, while Google generated $13.83 in market value for every dollar of sales. Microsoft's value/revenue ratio is just like another major player in software and servers: in 2006 Oracle's was 6.97.  The gaming segment accounted for about 10% of Microsoft's revenues. Nintendo, a stand alone competitor with similar gaming revenues, had a v/r ratio of 4.50 in 2006. Is Microsoft stuck a rut they want to get out of? If so, DoubleClick might be part of the solution.

GERSTNER'S RULE
The first thing we need to know in order to understand what's driving these results is the enterprise marketing efficiency for each player. Lou Gerstner, in his book Who Says Elephants Can't Dance?, laid out a rule of thumb on enterprise marketing efficiency. It's simple and revealing: how much does it cost to generate a dollar in sales revenue compared with your competitors? This is Gerstner's cost per dollar (CPD) rule. It's one of two measures of enterprise marketing efficiency I use in my analysis of The Battle for Your Desktop.

REDMOND, YOU HAVE A PROBLEM
Enterprise Marketing Expenses (EME) are all the costs of the people and programs that influence how customers and investors think, act and feel about a company.

Cpd_msft_goog_yhoo_41707_p013_3

In 2006 Microsoft spent $6.584 billion on R&D, plus an additional $13.576 billion on Selling, General and Administrative expenses. So, the company's total bill for enterprise marketing came to $20.160 billion. It cost Microsoft 45.5¢ to generate one dollar in sales in 2006.

Google spent $1.229 billion on R&D, plus another $1.601 billion on Selling, General and Administrative expenses for a total enterprise marketing expenditure of $2.830 billion. So, Google's CPD was just 26.7¢.

THE PUNCH LINE
It cost Microsoft 18.8¢ more to generate a dollar in sales than it cost Google. Multiply that 18.8¢ times its sales revenues and you find that Microsoft has an $8.3 billion dollar problem. That's how much the company was over-spending on enterprise marketing in 2006 compared with Google. At the beginning of this post I said increased revenues feed back on market valuation with the promise of increased cash flow. And higher market valuations feed back on revenues by providing cash for acquisitions. Can Microsoft's overspending problem be solved by the acquisition of DoubleClick? What do you think?

~V

February 23, 2007

The Greatest Asset

Take a look at this eye-opening video by Microsoft called "The Greatest Asset." This video is short and compelling. Quiet but passionate. Emotional too. Kind of a high-tech-take-off on Ebenezer Scrooge in the 21st century.

What's this got to do with my book? It dramatizes two of the main messages in my chapter on Enterprise Marketing Expenses. First, people create a company's intangible market value. Second, if only implied by the characters the CEO talks with, the costs of people in a manufacturing business are reported in financial accounting documents as Selling, General and Administrative expenses.