Did you ever notice that financial metrics are two dimensional? Take the most recent reports on Citigroup (NYSE: C) from Yahoo! Finance:
P/E (Price to Earnings);
EPS (Earnings per Share);
P/S (Price per Share);
EV/R (Enterprise Value per Revenue).
All two dimensional. What's the missing 3rd dimension? Competition. When I tell my students this, one of them always says:
"That's easy to fix. Just compare the company on each ratio with its peers."
Sorry, but that's not the point. Applying a 2D metric to competitors does not a 3D comparison make. Does it really matter? Yes, it can matter a lot. As you'll see in this report. The second in my series on investment banks.
The purpose of this post is to document the different results produced by 3D enterprise marketing metrics. And to explain their significance to management and investors. I apply these metrics to Citigroup and four of its competitors: Goldman Sachs Group (NYSE: GS); JPMorgan Chase Co (NYSE: JPM); Merrill Lynch & Co. Inc. (NYSE: MER); and Morgan Stanley (NYSE:MS). I call these metrics "Differentials."
MARKET SHARE IS THE 3rd DIMENSION
Performance in a strategic group is relative. Management's belief in the superiority of their company's performance matters far less to investors than how it stacks up against its peers. In making comparisons with peers, it's the interaction between two separate but equally important markets that determine a company's shareholder value. There is simple and revealing way to assess how any public company is doing in both markets: compare its share of value (SOV) in equity markets with its share of revenue (SOR) in product markets. Market share is the 3rd dimension.
VALUE SALES DIFFERENTIALS
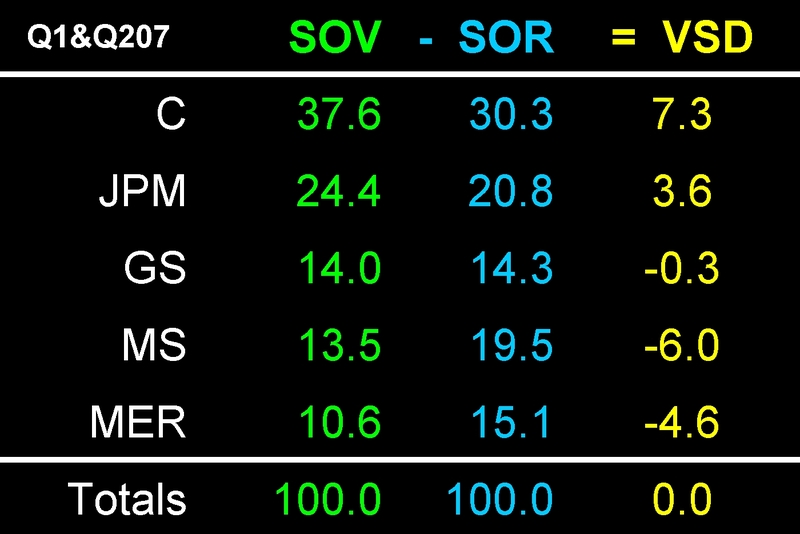
The following table reports SOV and SOR for each company in either the 1st or 2nd quarter of 2007 (depending on their fiscal year end). The first step in capturing the 3rd dimension in enterprise marketing is to take the difference between a company's SOV and its SOR. The result is the Value-Sales Differential (VSD).
Consider Citigroup. At the close of its first fiscal quarter in March, 2007 the company created $254.0 billion in shareholder value. This was 37.6% of the combined $675.8 billion value of all five firms. Yet, Citi's $43.0 billion in revenue was only 30.3% of the $142.1 billion in combined sales revenues. The VSD was +7.3 points. In short, Citigroup's value creation in the period exceeded its revenue churn by over seven points.
On the other hand, at the close of its first fiscal quarter in March, 2007 Merrill Lynch created $71.4 Billion of the group's total $675.8 billion in shareholder value. This was only 10.6% of the group's total value. In the same quarter MER generated revenues $21.5 billion, or 15.1% of group sales revenues. Leading to a value-sales differential of -3.8 points. In short, MER's revenue churn exceeded its value creation by almost four points in May, 2007.
Finally, notice the sum of value-sales differentials over the five companies is zero. Is this an accident? No. The sum of V-S differential across a sample of companies in the same time period has to be zero. That's because we're taking the differences between two sets of integers that both sum to 100.
WHY A DIFFERENTIAL?
You may wonder why I use a differential rather than the ratio of value to revenue. Actually I use both, but for different reasons. There are three reasons for using a differential in this 3D enterprise marketing metric. First, a differential is derived from my theory of enterprise market shares. If you're interested in the details see the 18 minute Adobe Connect presentation "Y'all Buckle that Seatbelt." Second, a differential is better behaved than a ratio. It's bounded by upper and lower limits of +100 and -100 points. The upper limit of a ratio is unbounded. Third, no matter how large or small the differential is for any given company, the sum of the differences for a cross-section of companies will always be zero. These properties ensure that value-sales differentials are comparable across strategic groups of any size and time period. In short, the value-sales differential is a standardized 3D enterprise marketing measure of relative firm performance in stock and product markets.
WHAT ABOUT RISK?
Of course these differentials change from period to period. How do I control for that? In basically the same way risk is handled in corporate finance ... by adjusting for volatility. The classic risk-adjusted rate of return in finance is calculated in two steps. First, the risk-free rate of interest is subtracted from the returns on a given portfolio over time. Each of these returns then is divided by their standard deviation. I use a simple variation on this theme. First, share of revenue is subtracted from share of value in a given strategic group over time. Each of these differentials is then divided by their standard deviation.
CALCULATING RISK-ADJUSTED DIFFERENTIALS
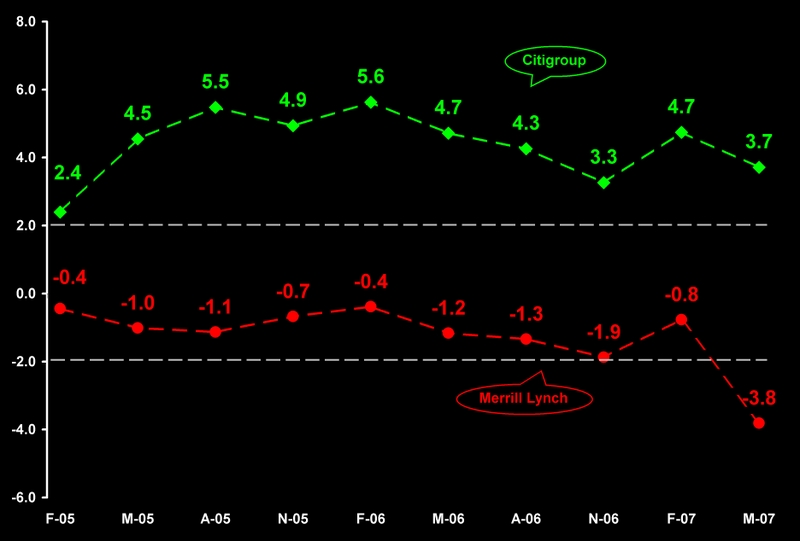
This chart shows Citigroup's share of value (in green) and its corresponding share of revenue (in blue) over the ten quarters from December, 2004 through March, 2007. In contrast to the table above (where Citi's SOV and SOR were 37.6% and 30.3% respectively in M-07) here you see the whole time series. [Click on chart to enlarge]

Citigroup's VSD increased from +4.7 points in D-04 to +7.3 points in M-07. It peaked at +9.3 in M-06. If you calculated the standard deviation of Citi's ten differentials you would find it's 1.97. Dividing each VSD by 1.97 creates a risk-adjusted series. For example, the company's risk-adjusted differential in M-06 was +4.7 (9.3/1.97). Make a note that both SOV and SOR are multiplied by 100 to create a whole-numbered index. This transformation is important because it makes the results much easier to interpret. Also note that RAD is a standard-normal variable: its standard deviation is 1.0 and its expected value is zero. This is a particularly useful property when interpreting its meaning.
INTERPRETING RISK-ADJUSTED DIFFERENTIALS
RAD is standard normal whole numbered index of a firm’s simultaneous performance in stock and product markets. As a result, you can draw several conclusions from a firm's risk-adjusted differentials. Here are just three general cases. Whenever RAD:
• Hovers around zero for a number of periods, investors have neither awarded a premium to nor discounted from the company’s share of market value relative to its share of revenues. This reflects average expectations for the company's future product/stock market performance.
• Is a positive number and greater than +2.0, investors have awarded a significant premium to the company’s share of market value relative to its share of revenues. An unbroken series of RAD numbers greater than +2.0 reflects high investor expectations for a company's future product/stock market performance.
• Is a negative number and less than -2.0, investors have significantly discounted the company’s share of market value relative to its share of revenues. An unbroken series of RAD numbers less than -2.0 reflects low investor expectations for a company's future product/stock market performance.
Of course, the world is not this simple. Given the definition of RAD it is rare to observe numbers either greater than +2 or less than -2 over several time periods. The investment banks in the following analysis make this point.
LEADING AND FOLLOWING BANKS
This chart shows risk-adjusted differentials for the leader (Citigroup) and a follower (Merrill Lynch) in a strategic group of five competitors. The Y-axis calibrates risk-adjusted differentials, ranging from -8.0 to +8.0. The X-axis calibrates time in quarters. The dashed gray lines at +2.0 and -2.0 are akin to statistical control limits at two standard deviations above and below the expectation. Any observation above or below these limits is statistically significant at a 95% confidence level. [Click on chart to enlarge]
Citigroup is one of those exceptional cases. It posted RADs greater than two standard deviations above the mean in all ten quarters. In a study I did of 38 Marketing Science Institute member companies and 299 of their competitors from 1991 through 2000, I found only twelve (3%) posted RADs greater that +2.0 in every period. So it is with good reason that I call companies like Citigroup "High-Flyers."
As you would expect, the lion's share (91%) of all firms in my study of MSI companies and their competitors posted RADs that remained between plus and minus 2.0 over the entire decade. Merrill Lynch is one of these "Average Joes." But there's more information in MER's numbers. First, notice all of its RADs are less than zero – it performed below average in all ten quarters. Second, the trend is not favorable. Third, this already unfavorable trend dropped to -3.8 in March, 2007. This is not a good sign.
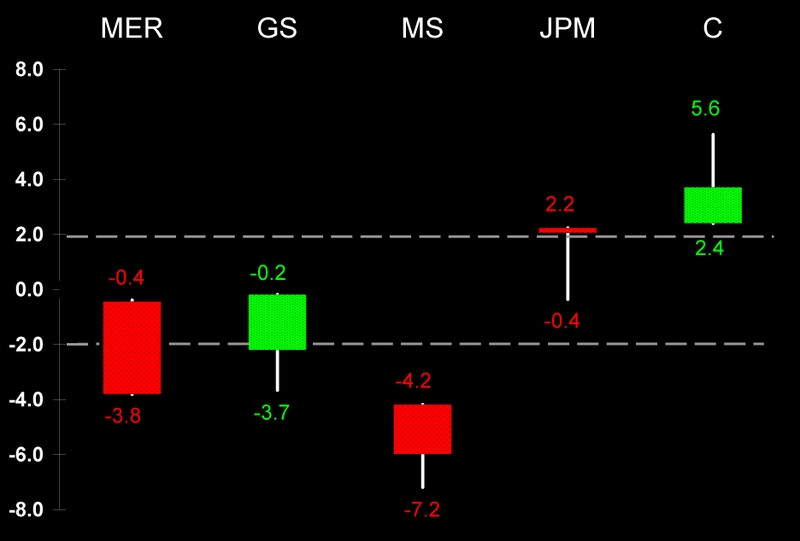
CANDLESTICK RADs
The candlestick chart is an efficient way to summarize the risk- adjusted differentials of all five companies over the ten quarters. In this chart two companies (GS and C) have green candles because each has an ending RAD in March/May 2007 greater than a beginning RAD in December/March 2005.Three companies (MER, MS, and JPM) have red candles because each has an ending value less than a beginning one. [Click on chart to enlarge]
The size of a candle itself represents the spread between beginning and ending RADs. For example, MER's candle portrays the beginning and ending ones in the earlier time series chart, 0.4 and -3.8 respectively. It also captures the downward trend since no value outside this range appears as "wick" on top of MER's candle.
The wicks on each candle in this chart represent extreme departures from the beginning and ending RAD numbers. For example, Morgan Stanley posted a low of -7.2 in one quarter. And while Goldman Sachs posted a big increase, from -2.2 to -0.2, it none-the-less experienced a low of -3.7 in one quarter along the way.
SHOULD YOU WORRY?
Should Merrill Lynch, Morgan Stanley, and Goldman Sachs be worried about their risk-adjusted differential performance? Yes. Investors are telling management that something's substantially wrong ... relative to the performance of their peers. You can't pick up this signal from any two-dimensional financial indicator. In fact, some of the common indicators used in stock valuation can be downright mollifying.
Consider the market value/revenue multiple for example. Merrill's v/r multiple (ttm) slipped the most from 1.55 to 1.07; a 31% drop. And Citigroup's fell from 1.98 to1.64; an 18% drop. While Morgan Stanley's went from 1.18 to 0.99; a 16% decline. Finally, JPMorgan's fell from 1.61 to 1.56; this 3% decline was the smallest of all five companies.
2D IS TOO NARROW
Two dimensional financial metrics are too narrow because they fail to incorporate directly the effects of competition. Should investors re-evaluate Citigroup and its peers in light of the added information contained in their 3D enterprise marketing metrics? What do you think?
Stayed tuned for the third installment in this series on investment banks: "Citigroup Enterprise Marketing Risk and Efficiency" will appear next week. Same time, same place.
~V


V,
I am in touch with the CCC group who did our BLM report on Dell. Interestingly enough, our twelve month price target on Dell wasn't too far off the mark...but August of 2005 saw the beginning of a steep decline in the share price of the company. Dell's stock price bottomed out in August of 2006 at ~USD~18/share and hasn't seen the 30's since. With M. Dell taking the helm again, it will be fascinating if the capital markets reward the company for his initiatives. Dell's move into the low-end retail world (putting Dell's on the shelves of WalMart) is a dramatic move away from their core business plan. Is it a nod toward the commoditization of the industry (if so, it's about 5 years too late!) or is it a positioning move to put Dell in the minds of the lower-end consumer? If it is the later, I am not encouraged to take a position in the company...they would be playing a dangerous low margin game. Their direct to consumer model was revolutionary; it's sad to see them hold on to it a tad too long and not evolve...but this is another conversation for the Strategy Dept.!
Best,
mD
Posted by: CCCAlum | October 05, 2007 at 06:11 PM
mD,
You didn't miss the point at all. It's a good idea always to "push a competitor into a group that does not – at first blush – seem appropriate." What a great example Hubig's Honey Fruit Pies make. I'll bet they're not on P&G's radar screen! And with a short shelf life maybe they shouldn't be ... unless they can find a way to extend shelf life like they did with Pringles. Readers not familiar with Hubig's might want to read Emeril's short history at http://www.emerils.com/cooking/archives/000658.html.
But, sometimes you have to plow the straight and narrow field, as I found out in the investment banking case. This is a result of the convention of reporting revenues net of interest. As Veryinterested points out in his (or her) comments, this leads to very different capital structures for wholesale bankers like GS, LEH, MER and MS with an average interest expense to gross revenue ratio in the 55% range. While investment banks with a big retail position, like Citigroup and JP Morgan, have an interest expense to gross revenue ratio in the 40% range. Using net revenues in these cases dramatically changes risk-adjusted differentials and hence throws off the results of my competitive stock pricing model.
Great to hear from you. It must be going on three years since you and your team did a Bottom Line Marketing report on Dell and its competitors. Are you in touch with the other members of your team?
~V
Posted by: Victor Cook, Jr., New Orleans, Louisiana | August 22, 2007 at 10:52 AM
VeryInterested and V,
It is with great interest I read your posts...I am both a financial professional and an alum of Victor's...It is good to see this debate lending to the evolution of Victor's research.
One thing to mull over with respect to the companies mentioned here: How do customers perceive the institution?
I have clients who view MER, GS, LEH, JPM, and MS all as competitors of C. Each firm markets to the high net worth demographic and actively pursues this business. The same is true on the I-Banking side, i.e. companies (public and private) looking to raise capital look to these firms for deal structures. So, both the individual investor and the corporate investor are customers of these institutions.
As Victor knows, I am a Customer Experience geek at heart. At the core of CE is the customer perception (right or wrong) of the comapany, its product, their experience with the product and the company, AND the perception of the competitive landscape.
For example, let's take fruit pies. Being a NOLA resident, I am a proud consumer of Hubig's Honey Fruit Pies. Now, several major companies make and sell similar sugar-coated, fruit-filled, snack pies of similar taste and price point. However, I choose Hubig's and will go out of my way to avoid consuming a snack pie if Hubig's aren't available. Am I irrational in my behavior? No. I have an experience with this product, e.g. locally-owned company and great customer service, that goes beyond any narrow definition based on industry code which would put Hubig's in a strategic group with some rather large CPG companies.
When determining the strategic group for analysis, we must move beyond the 10Q or K and examine the more holistic variables that may push a competitor into a group that does not -- at first blush -- seem appropriate.
Victor, you may remember our similar quandry when deciding whether to include SUNW and IBM in our strategic group when examining DELL. HPQ and AAPL were natural fits in the consumer computer market, but we had to look at other business lines, e.g. servers and consulting to round out the group.
I hope I didn't miss this point in the comments on this blog...If I did, mea culpa.
Ever the champion of the customer/client,
mD
Posted by: CCCAlum | August 19, 2007 at 08:30 PM
Veryinterested,
Over the last several days I've been investigating my competitive stock valuation model applied to four investment banks (MS+GS+LEH+MER). The results I get for these banks just don't make sense ... the stock prices were way off for all of them.
Why? It must be because investors value these stocks partly on their income net of interest expenses. I used gross income because otherwise both risk-adjusted differentials and enterprise marketing efficiency would be "distorted." But, if investors consider net income as the top line, these "distorted" numbers are the real ones.
So I've been trying to figure out why, as you said, practitioners use net income, even though interest expenses are so important. Well, with all the focus on rates these days it finally got through to me: interest expense can't be treated as "cost of goods" sold because management has no control over the fed funds rate! Although they can hedge like Southwest Airlines does with the furture price of jet fuel, this is more like cost containment than cost management.
The good news is the maximum earnings market shares (and everything derived from them) in my later posts don't change much. The bad news I've got to recalculate risk-adjusted differentials from net income.
Thanks for your comments,
~V
Posted by: Victor Cook, Jr., New Orleans, Louisiana | August 08, 2007 at 05:33 PM
Veryinterested,
Since your last post I've looked closely into business segment disclosures to follow up on your suggestion that I remove Citigroup's retail banking revenues and costs, as well as the market value attributed to them, from my analysis. I think you're right, it can be done.
First, interest expenses are not reported by segment. But they are so highly correlated with gross income (MS 0.99; JPM 0.99; GS 0.95; MER 0.96; and C 0.96 over the last ten quarters) that interest expense can be recovered with high reliability using segment net income as a percent of total net income. That would solve the "cost of goods sold" problem.
Second, as far as I can tell operating expenses by segment appear only in the annual report, so assumptions about their distribution over the year must be made. In addition, reported operating expenses include depreciation, which should be removed. Again, this could be done as a percent of net income.
Third, as you suggest, earnings per share could be used to allocate market value to each segment, though the correlation between the two is unobservable. So we don't know how much error this introduces.
Finally, the same adjustments must be made to JPM's numbers too, since they also have extensive retail banking operations.
While this can be done, I think it is best left up to a practitioner with extensive knowledge of banking operations. If you're interested in following up on this I would welcome your input.
As you will see in my post later today, I've addressed your questions about the advantages given to Citi (and JPM) compared with GS and MS as a result of the significant differences in revenues from businesses in which the latter do not compete. Eliminating Citi and JPM while adding LEH does produce a different picture of investment banking. In some ways it is "better" than the picture including Citi and JPM.
Thank you for your comments. I find them insightful and thought provoking. Best regards,
~V
Posted by: Victor Cook, Jr., New Orleans, Louisiana | July 22, 2007 at 09:35 AM
"I know this is not the way practitioners see banking operation, but will they be willing to accept this point of view for my analysis?"
Not sure. I think your analysis will be most convincing to the practitioners if presented with the vocabulary familiar to the practitioners. Alternatively, you can tell them why their way of viewing their business, while historically useful, is not ideal in light of current developments. They, the bankers, tend to be very practical and results oriented.
Strategic Group Definition
I spent a fair amount of time reviewing the leading commercial and investment banks -- Citi, GS, MS, MER, BAC, JPM, Deutsche Bank. It is very informative to review the business segment disclosures available in their filings with the SEC. In doing so, one will find meaningful similarities but also significant differences in the businesses in these companies.
I am not sure what percentage overlap should be considered for purposes of measurement. But as I understand your analysis gives competitors like Citi a benefit because they generate significant revenues in a business in which GS and MS do not compete. As such, this methodology would tend to overstate the strength of large companies (Citi, BAC, JPM) when compared against smaller, more focused companies (GS, MS, MER).
I think eliminating Citi from the universe and adding LEH and BSC would produce a better picture of investment banking.
If you were focused on Citi, I would probably look at the analysis excluding the investment banks and adding some more direct competitors such as JPM and BAC.
Alternatively, you could adjust by subtracting the revenues and earnings, and estimated market caps based on comparisons to peer p/e multiples. While you have said you are uncomfortable with that approach, it is a pretty standard approach to securities and company valuation analysis.
Regards.
Posted by: veryinterested | July 21, 2007 at 12:10 PM
Veryinterested,
You raise three important issues in your comments that I hope to resolve in this reply: (1) gross vs. net revenue, (2) interest income and customer base and (3) strategic group definition.
GROSS vs. NET REVENUE IN BANKING
In your last comment you say that "...practitioners in the financial services industry focus on the line item "net revenues", as opposed to "gross revenues", because of the significant leverage in the balance sheets of financial services firms." I understand and accept your point. However, my analysis of maximum earnings market share (which I plan to do later in this series) depends on having acceptable definitions of cost, profit, and earnings in bank operations.
"Two different views appear in the literature: the *intermediation approach* and the *production approach.* The intermediation approach views banks as using deposits together with purchased inputs to produce various categories of bank assets, measured by their dollar values. Total cost is defined as the interest expense of deposits, less service charges, plus the expense of purchased inputs. In contrast, the production approach views banks as using purchased inputs to produce deposits and various categories of bank assets. The production approach measures outputs in numbers of accounts and defines total cost as noninterest operating costs (that is, the cost of purchased inputs)." SeeMitchell and Onvural, "Economies of Scale and Scope in Large Commercial Banks," Journal of Money, Credit and Banking, Vo. 28 (May, 1966), pages 184-185.
I use the intermediation approach to bank operations in my analysis. In this view, interest expense is the "cost of goods sold," net revenues are "gross profits," purchased inputs are "enterprise marketing expenses," and the residual is operating income before depreciation. Applying this definition to Goldman Sachs in their 2nd quarter of 2007: gross revenues of $20.351 less interest expense of $10.169 yields a gross profit (net revenue) of $10.182, less enterprise marketing expenses of $6,351 returns an operating income before depreciation of $3,831 billion.
I know this is not the way practitioners see banking operation, but will they be willing to accept this point of view for my analysis?
INTEREST INCOME AND CUSTOMER BASE
In your last comment you also say "... in a levered financial institution, a company can only prudently engage in activities which are supported by its capital and liability structure." I also accept this point. But, I would like to know if Citigroup's capital and liability structure are so much different from the other investment banks that the comparisons are not meaningful. Do you think Citi is that different?
STRATEGIC GROUP DEFINITION
You conclude your last comment by saying ”... I'd be interested in the results of your analysis, after adjustments to focus on markets where the commercial and investment banks actually compete with one another. I think your conclusions would be stronger if tested on the areas of direct overlap."
While reviewing the posts you pointed me to on Bankstocks.com I noticed that Tom Brown used ratios of the market cap of other banks to Citigroup's market cap. It's interesting that the break points he used were 50% or more; between 25% and 50%; and between 10% and 25% to compare return to large, medium, and small banks. These break points are very similar to those I used in assessing the "resource equivalence" of competitors on four dimensions: (1) market cap; (2) gross revenue; (3) gross profit; and (4) enterprise marketing expense. If a company had 50% or more of the industry leader's resources on any two of these measures I concluded they were "direct competitors" in the strategic group. If a company had between 20% and 50% they were "potential competitors." And if a company had less than 20% it was an "indirect competitor." For the details see my 11 minute Adobe Connect presentation at
http://breeze.tulane.edu/cookchapterthree/.
With Citigroup as the leader, Morgan Stanley's market cap, gross revenue, gross profit, and enterprise marketing expense ratios in the latest quarter of 2007 were 36%, 51%, 58%, and 42% respectively. JPM's ratios were 65%, 80%, 76%, and 85%. Goldman's were 37%, 47%, 45%, and 50%. Merrill's were 28%, 44%, 51%, and 34%. As you can see, I stretched my own guidelines a bit by including Goldman and Merrill in the strategic group because each firm has only one dimension equal to 50% or more of Citigroup. Strictly speaking they are just potential competitors. Though on one or two others dimensions they were very close.
I know these technical points don't resolve your concerns about including Citigroup in my analysis. And unfortunately I would not be comfortable deleting non-comparable Citi revenues and adjusting for the market cap to which they contribute. In any event, doing so would require similar adjustments in interest costs, enterprise marketing expenses, and operating income before depreciation in order to estimate maximum earnings market share.
A RESOLUTION ON CITIGROUP?
There is another way around this issue that may be useful. I could rerun my analysis of 3D marketing metrics without Citigroup. Would this create results where the four remaining investment banks compete with each other more-or-less across the board?
Thank you for your comments. With best regards,
~V
Posted by: Victor Cook, Jr., New Orleans, Louisiana | July 17, 2007 at 04:57 PM
I think you'll find that practicioners in the financial services industry focus on the line item "net revenues", as opposed to "gross revenues", because of the significant leverage in the balance sheets of financial services firms.
Thus, while gross revenues are reported in 10-Qs, everyone discussses net revenues in their press releases, and internally when evaluating business performance. While GS reported gross revenues of $20.351bn for the second fiscal quarter ended May 2007, its press release and MD&A commentary focuses on the $10.182bn of net revenues.
The same is true of Merrill Lynch.
http://files.shareholder.com/downloads/MER/147201621x0x91351/ae8f7808-be40-4be0-a0b4-8e4d7acf225d/1Q07%20Earnings%20Release-Final.pdf
If you still doubt the importance of net revenues compared to gross revenues, just look at how the people are paid. It's as a perentage of net revenues.
The "investor who follows Citi" is Tom Brown, a former equity research analyst and now hedge fund manager. In addition to investing, and unlike most other hedge fund managers, he blogs, for attribution, about some of his ideas.
http://www.bankstocks.com/
The Citi numbers were taken from one of his write-ups.
http://www.bankstocks.com/article.asp?id=9881223
You write that "a bank's interest income is totally independent of its customer base". I'd disagree because in a levered financial institution, a company can only prudently engage in actvities which are supported by its capital and liability structure.
Thus, you don't find many investment banks trying to fund and hold 5 year coporate loans on their balance sheet because on average they have less stable funding (liability sources) and better uses of capital.
Occassionally you will see financial institutions pursuing an investment strategy independent of their funding, without due regard for asset liquidity and liability structure. Those circumstances usually end up being memorable because they lead to spectacular failures -- Drexel Burnham, Executive Life, Providian, New Century, etc.
So, I'd be interested in the results of your analysis, after adjustments to focus on markets where the commerical and investment banks actually compete with one another. I think your conclusions would be stronger if tested on the areas of direct overlap. Then you can build the case for comparison on other apparently contiguous markets.
Regards.
Posted by: veryinterested | July 16, 2007 at 10:39 PM
Veryinterested,
Four of the investment banks in my analysis reported their interest income separately from non-interest income. Citigroup in the 1st quarter of 2007 had revenues of $43.0 billion. About 65% of Citi's revenue was interest income ($17.6 billion). Goldman's 2nd quarter revenue was $20.4 billion. About 55% of that was from interest income. Merrill's interest income was about 60% and JPM's about 56% of total revenues.
If 55% to 65% of your revenues are due to interest income, it makes exploring what goes on at the edges of your market even more interesting -- a bank's interest income is totally independent of its customer base. So this interest income "cushion" gives anyone (even Wal*Mart) the freedom to expand in any customer or service direction management thinks will grow shareholder value by capturing it from current vendors. What you suggest simply requires the analysis of future opportunities be limited by the past. Have you read "Value Migration?"
By the way, I think introducing estimates of 2007 earnings by "an investor who follows Citi" as evidence in this discussion adds little of value without more information. On what revenues are these earnings estimates based? What percentage of earnings by segment is due to interest income?
You also stretched my grocery store metaphor beyond reasonable limits. After all I didn't include PayPall as a member of this strategic group!
Even so, I too enjoy the conversation. With best regards,
~V
Posted by: Victor Cook, Jr., New Orleans, Louisiana | July 16, 2007 at 07:44 PM
I agree that competitors will change as time passes.
Whole Foods and Kroger compete. They both offer food for individuals to feed themselves. Kroger also competes, to a lesser extent, with McDonalds, and other quick-serve restaurants, and to an even lesser extent with Blockbuster, which also sells snack items at its checkout stand.
Sysco is also in the food business, but it distrbutes goods as a wholesaler to restaurants. And McLanes, a subsidiary of Berkshire Hathaway, distributes snack goods to grocery and convenience stores. Sysco and McLanes are both in the food business, but I don't think we'll learn much by comparing them to Kroger.
That's my point with Citi and GS. They both are in "investment banking", but in fact they business are very similar in some respects and not at all related in others. I think analzing the both as if they are both serving the same customers is a mistake, bacause they do not serve the same customers. And to extend the food industry metaphor, Citi's activities are focused in retail food retailing and GS's activties are centered, almost exclusively, in food wholesaling.
Just to be clear, here are some figures from an investor who follows Citi. The numbers shown are estimated 2007 earnings:
Investment banking $7.8bn
Domestic consumer finance $8.5bn
International consumer finance $4.7bn
Retail wealth management $1.6bn
So Citi's investment banking business represents about 1/3 of its total earnings. By the way, I think you can, as I mentioned in my earlier post, fairly ascribe a market value to the activities of Citi that are not related to GS's activities.
While such an exercise may not lead to a precise valuation, it will lead to a better informed decision.
In fact, that's what Morgan Stanley's board did prior to deciding that it would best serve the interests of Morgan Stanley shareholders to spin-off it Discover credit card business.
I again repeat that I think it is valuable to assess market position by looking at which firms are capturing which share of the market. At the same time, you can't define the market so broadly that you end up comparing a very large firm in a wide range of actvities with a large, but smaller firm, in a more constrained set of activities.
I enjoy the conversation.
Kind regards.
Posted by: veryinterested | July 16, 2007 at 05:30 PM
Veryinterested,
The short response to the issues you raise is this: Strategic groups are inherently dynamic collections of companies that compete simultaneously for customers and capital. The companies that managers think are their competitors will change from year-to-year, if not from quarter-to-quarter.
MARKETING'S MYOPIA
The greatest blinder to understanding enterprise marketing was planted in the mind of every business school student by marketing professors themselves: Their micro-marketing perspective says that companies are competitors only if they serve the same customers, fulfill the same needs, and deliver the same solutions. When you add the dimension of competing simultaneously for customers and capital, then throw in the impact of M&A dynamics on the competitive landscape, it's clear that this conventional definition of competition is not up to the job of analyzing enterprise marketing strategies.
DO WHOLE FOODS AND KROGER COMPETE?
Grocery stores in the same trading area with the same mix of products and services that compete for the same customers would fit the micro-marketing definition of competing firms. However, such a narrow focus makes it impossible to conduct an analysis of the competition for shareholder value. You can't measure the market value of a local supermarket because it is not traded on a stock exchange. Such a restrictive definition of a grocery chain strategic group also would exclude Whole Foods Markets Inc. as a competitor of Kroger. This omission would hide useful enterprise marketing information from investors.
Theoretically the companies in a strategic group have (or might acquire) a high degree of market commonality and resource equivalence. If you're interested in the details, see my 11 minute Adobe Connect presentation "Who's in My Strategic Group?" at http://breeze.tulane.edu/cookchapterthree/
PRACTICAL IMPLICATIONS
What does this mean in practical terms? The companies currently (or might in the future) share a lot of customers and have similarly deep pockets. Using these criteria the five "investment banks" in my analysis can properly be treated as strategic group. Many others also could be included, especially European and Asian banks, that are beginning to make inroads in U.S. markets.
A trade-off between "deep pockets" and "shared customers" is involved in the definition of a strategic group. In the broadest sense, every firm is in competition with all other firms in its competition for capital; however, a limit is imposed by the requirement for some level of current (or anticipated) product market commonality. Otherwise, we lose an important dimension of the competitive effects (shared customers) embedded in a strategic group. In the narrowest sense, there exist few pure competitors for a firm’s customers since its products are, to some extent, unique.
THIS INVESTMENT BANKING GROUP
My goal in this analysis was to achieve a balance between the market commonality and resource equivalence among investment banks. In addition, I wanted a definition that will be meaningful in the future. Ask yourself: Do these investment banks fill this bill?
A FINAL POINT.
Subtracting Citigroup's non-overlapping revenues will not improve the analysis because you cannot subtract that portion of its market cap created by those revenues. Enterprise marketing requires a new and different perspective on competition.
Thanks for your comments.
~V
Posted by: Victor Cook, Jr., New Orleans, Louisiana | July 16, 2007 at 12:53 PM
The concept you describe may have merit, but it can only be useful if markets are defined correctly.
For example, if you look at the revenues and earnings of Citigroup and Goldman, you will find that Citi participates in many markets that Goldman does not participate.
Thus to make a meaningful comparison between Citi and GS, you should subtract from Citi's totals the revenues and ascribed market value for activities in which GS does not compete. Only then can you make a direct comparison between Citi and Goldman.
Now, the comparsion may be somewhat more valid between Citi and MER and MS, because MER and MS engage in a broader range of activities. But, even MER and MS do not really compete over the broad range of Citi's activities.
Posted by: veryinterested | July 16, 2007 at 11:18 AM