Dow Jones: The Economics Didn't Make Sense?
Sorry to disagree with analysts at two of the biggest companies on the planet, but the economics make a lot of sense if you look at the long term impact of Mr. Murdoch's buyout of Dow Jones through the lens of the enterprise marketing framework.
BACKGROUND
In my post on "Dow Jones: Anomaly or Hidden Value? I placed the company in a strategic group with the New York Times (NYSE: NYT), Gannett Company Inc. (GCI), and the Tribune Company (TRB). The result of applying my Competitive Stock Valuation theory suggested that both the market and Mr. Murdoch undervalued Dow Jones. The present value of its stock four years out was $75 a share, or the company was worth a little over $6 billion. I discounted the forecast (nominal) value of its stock in 2010 (about $118) by 12.5% to adjust for my guess about the riskiness of Mr. Murdoch's acquisition.
THE HEAVYWEIGHTS: IT DIDN'T MAKE SENSE
At 9:00 this morning the following report appeared on the New York Times DealBook:
General Electric’s NBC unit and Microsoft explored making a joint bid for Dow Jones … But after the preliminary discussions and a more detailed analysis by NBC and Microsoft executives, they decided against going further. “Mainly, the economics just didn’t make sense,” a person close to NBC and Microsoft told The Times.
WHAT WOULD MURDOCH DO?
On June 6, 2007 Steve Stecklow and Martin Peers published a wide ranging interview of Mr. Murdoch's role as a proprietor and his plans for the Journal. This was one of the most revealing exchanges in that interview:
WSJ: So you would focus on generating more ad revenue?
Mr. Murdoch: … The Journal has had no money spent on marketing that I'm aware of for years. I imagine whatever we do would take the profit down in the short term… I mean of the Journal… It's got to have money put back into it, particularly on the digital side.
STRATEGIC ASSUMPTIONS
What if his bid for the company were successful? To find out I made these assumptions as inputs in my Competitive Stock Valuation model to forecast DJ's price in 2010:
(1) Mr. Murdoch's skill at running a paper combined with his marketing savvy would cause the CAGR in group revenues to jump from its historical 3.8% to 4.8%.
(2) he would stop in its tracks the steady 2.3% compound average annual decline in DJ's percent gross margin;
(3) his competitors would back-off the compound annual rate of growth in enterprise marketing (SG&A) expenses from 4.2% over the past decade to 1.8% in the ensuing four years;
(4) under Mr. Murdoch's leadership a revitalized Dow Jones would achieve maximum earnings market share;
(5) the number of shares outstanding would remain constant at 82.1 million.
THE ECONOMICS DON’T MAKE SENSE?
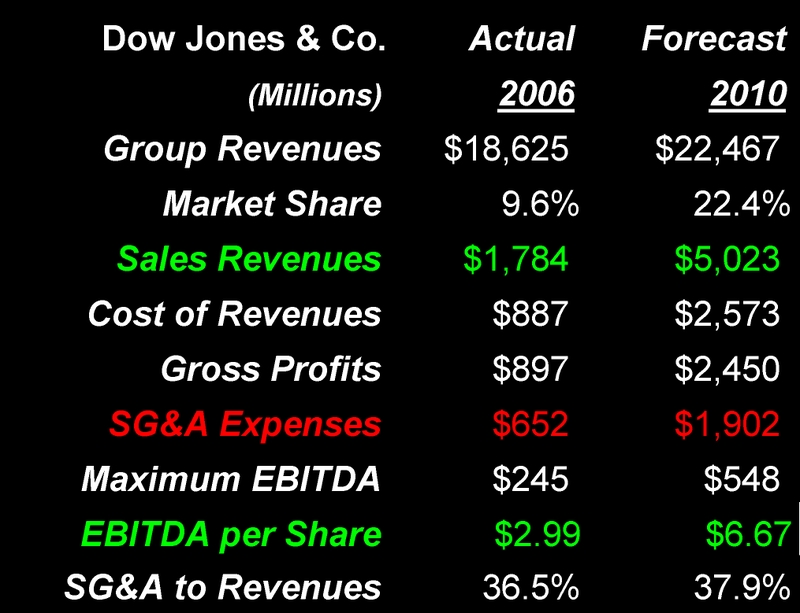
This table compares my 2010 Dow Jones forecast based on these assumptions with actual results in 2006. Group revenues increase from $18,625 to $22,467 million. DJ's share of group revenues increases from 9.6% to 22.4%, driving sales revenues up from $1,784 to $5,023 million by 2010. With profit margins held constant at 51% of sales, gross profits increase from $879 to $2,450 million in the forth year. With Mr. Murdoch pouring money into enterprise marketing, SG&A expenses nearly triple from $652 to $1,902 million.
The last three lines in this table are where it gets really interesting. Earnings (EBITDA) nearly double from $245 million to $548 million, driving EBITDA per share from $2.99 to $6.67, while the SG&A expense to revenue ratio increases only about 4%.
THE MOMENTUM EFFECT
How can Dow Jones become so radically transformed under Mr. Murdoch's leadership that it's 2010 stock price is $118? By becoming what Professor J. C. Larreche of the INSEAD Business School in Fontainebleau, France calls a "momentum-powered firm."
It all comes down to delivering more compelling values to its advertisers, its readers, employees, partners and shareholders -- and focusing on those that deliver the greatest equity to Dow Jones & Company. More on Professor Larreche's book on "The Momentum Effect" in later posts.
~V
Great finds
- Casino Italiani Non Aams
- Nuovi Siti Casino
- Casinos Not On Gamstop
- Casinos Not On Gamstop
- Casino Sites Not On Gamstop
- Casino Online Non Aams
- Casino Online Non Aams
- Casino Sites Not On Gamstop
- Best Casinos Not On Gamstop
- Sites Not On Gamstop
- Non Gamstop Casinos UK
- Best Non Gamstop Casinos
- Non Gamstop Casinos UK
- Casino Sites Not On Gamstop
- UK Casino Sites Not On Gamstop
- UK Online Casinos Not On Gamstop
- Non Gamstop Casino
- UK Online Casinos Not On Gamstop
- Sites Not On Gamstop
- Non Gamstop Casinos
- Non Gamstop Casino Sites UK
- Non Gamstop Casinos UK
- Casinos Not On Gamstop
- Casino Non Aams Sicuri
- Casino Not On Gamstop
- Casino Online
- Meilleur Casino En Ligne Français
- Nouveau Casino Belge En Ligne
- I Migliori Casino Non Aams
- Casinos En Ligne France
- Casino En Ligne France
- Paris Sportif Ufc France
- топ крипто казино
- Miglior Sito Casino Online
- Casino En Ligne Qui Paye Vraiment
- Migliori Casino Online Italia
- Site Casino En Ligne
- Meilleurs Casino En Ligne
- Tortuga Casino
- Casino En Ligne
- Casinos En Ligne
- Casino En Ligne Argent Réel
- Casino En Ligne Retrait Immédiat
- Casino En Ligne


