Google vs. Microsoft: Blue/Red Ocean Stock Pricing -- A Reply to SA Comments
My blog is syndicated by Seeking Alpha. Sometimes the comments posted there cut right to the heart of the matter. For example, in response to "Google vs. Microsoft: Blue/Red Ocean Earnings Productivity" a reader posted the following comment:
I get the idea that marginal costs should equal marginal revenues to maximize earnings. But it's not clear to me why you think the models can be safely extrapolated out ... Particularly in the Microsoft case -- where the model shows actual REP at -36%.
The purpose of this post is to address the issue of extrapolating relative earnings productivity and risk-adjusted differentials for Google (NASDAQ: GOOG) and Microsoft (NASDAQ: MSFT) in the competitive stock valuation model. The details on how this model works are published in Chapter 9 of my book Competing for Customers and Capital.
RELATIVE EARNINGS PRODUCTIVITY
Relative Earnings Productivity [REP] is based on a simple principle. As management comes closer to optimal spending the difference between its actual and maximum potential earnings will decrease. When this happens, other things equal, investors will bid up the company's stock price in recognition of that extraordinary achievement. Consider what Al Rappaport says in the second edition of his classic 1986 book Creating Shareholder Value:
It is … productivity that the stock market reacts to when pricing a company’s shares. Embedded in all shares is an implied long-term forecast about a company’s productivity – that is, its ability to create value in excess of the cost of producing it. When the stock market prices a company’s shares according to a belief that the company will be able to create value over the long term, it is attributing [this belief] to the company’s long-term productivity or, equivalently, a sustainable competitive advantage. In this way, productivity is the hinge on which both competitive advantage and shareholder value hang (Rappaport 1998, 69).
It was Professor Rappaport's insight that led me to formulate relative earnings productivity as one of the metrics needed to combine the concept of long-term efficiency with sustainable competitive advantage. But there is a link between efficiency and competitive advantage that I did not discuss in the post that prompted the comment above.
MARKET SHARE ATTRACTION THEORY
Market share attraction [MSA] theory says that, on average, in a competitive market a company will attract revenues in direct proportion to the share of expenses incurred in serving that market. The popularity of this model is based on several characteristics: it's logically consistent; it derives from four simple axioms; its parameters can easily be estimated; and it seems to outperform both linear and multiplicative models.
An interesting investigation into the properties of the [MSA] model is available in the 2001 paper "Why is Five a Crowd in the Market Share Attraction Model: The Dynamic Stability of Competition" by Paul Farris and his coauthors. Their analysis assumes that firms maximize earnings by optimizing their own spending based on competitors' last-period budgets and the MSA model.
RELATIVE EARNINGS PRODUCTIVITY
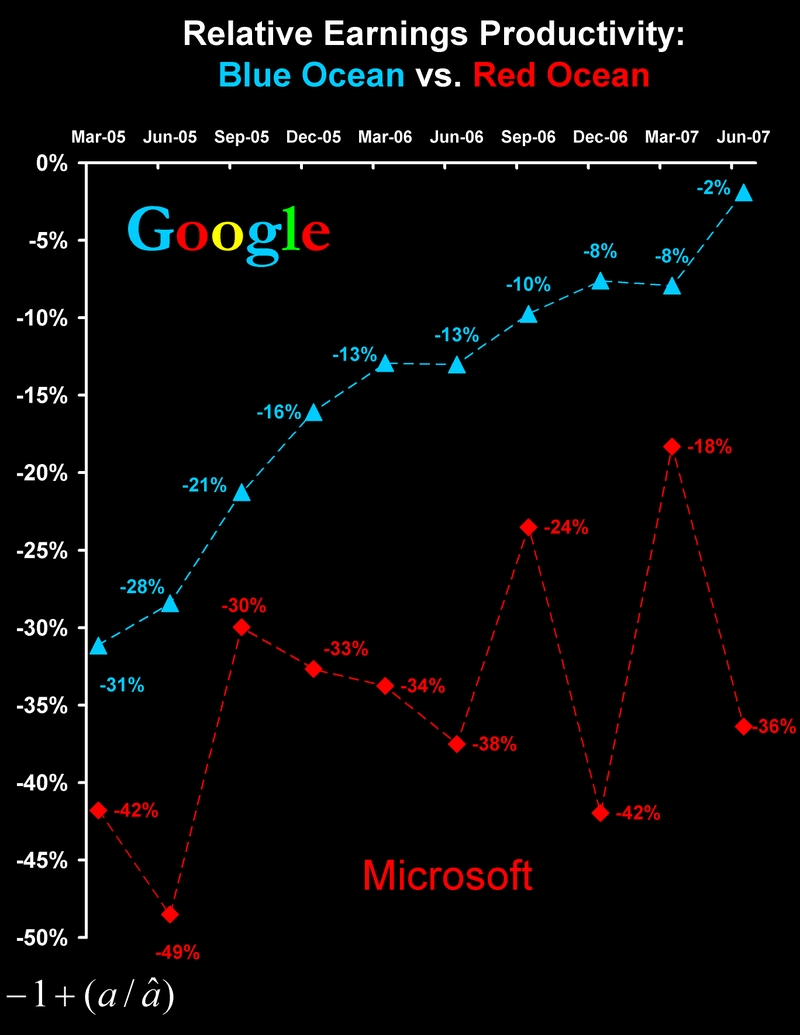
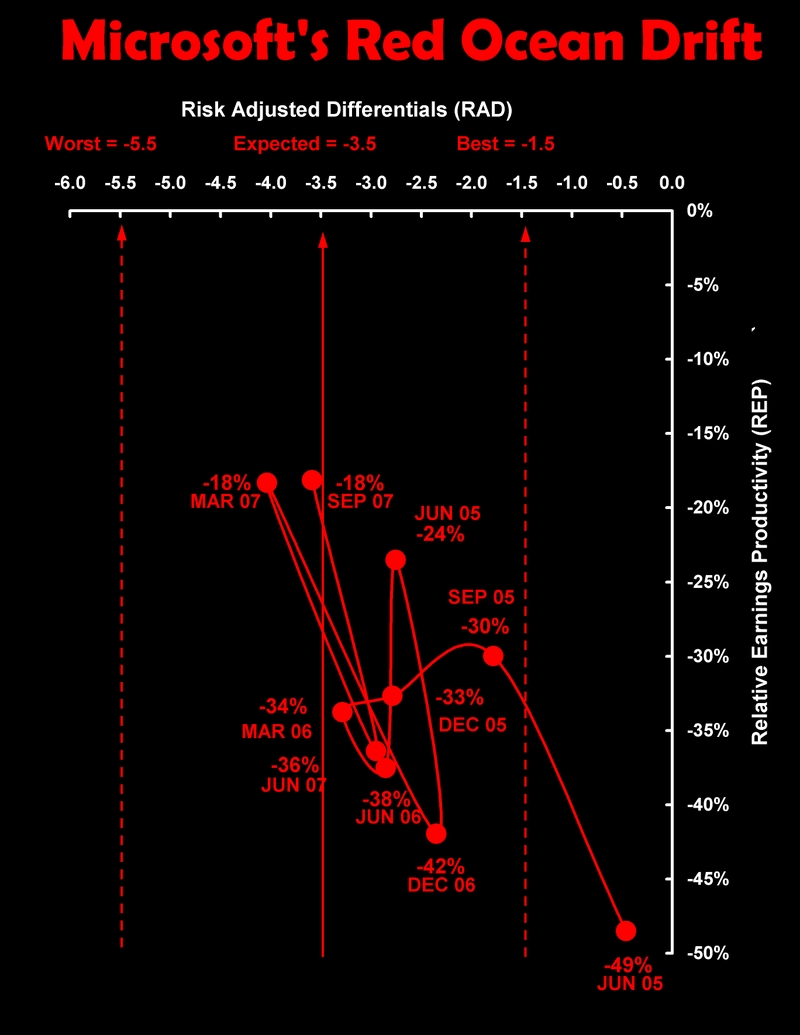
Since maximum earnings derived from the MSA model are nonlinear, so too is relative earnings productivity. This chart, reproduced from "Google vs. Microsoft: Blue Ocean vs. Red Ocean Earnings Productivity" shows relative earnings productivity for Google and Microsoft from March 2005 through June 2007.
They say a picture is worth a thousand words. Well, for investors and senior management of the companies, this chart is worth a million numbers. The quarterly time series reads across the top axis. The vertical axis reads off relative earnings productivity.

Relative earnings productivity equals the ratio of actual to maximum earnings added to -1 (see the equation at the bottom left of this chart). Why scale REP in this odd way? In order to depict a range from zero, where actual and maximum earnings are equal, to a very large negative number where actual earnings are far less than maximum earnings. The last observation in Google's REP schedule sends a clear message to investors. In the ten quarters following its IPO, Google management systematically guided the company to the point of nearly optimizing operating expenses and costs by the close of the 2nd quarter of 2007.
CLIMBING THE ATTRACTION CURVE
Oddly enough the calculation of relative earnings productivity using market share attraction theory assumes a strong linear relationship between sales revenues and company expenses. This assumption sometimes is violated in financial accounting data, but it is quite easily tested with a scatter diagram. The following chart shows the relationship between Google's share of operating expenses and costs [SOC] on the horizontal [x] axis and its share of revenues [SOR] on the vertical [y] axis.

Beginning with the quarter ending June 30, 2005 in the lower left-hand corner of the chart, Google incurred total operating expenses and costs of $909 million or 11.2% of both company's $8.081 billion total expenses and costs. Google generated $1.384 billion or 12.0% of $11.545 billion combined revenues. Now, 0.8% may not seem like much until you realize it represents an opportunity gain of over $65 million in expenses and costs of serving the market.
In the quarter ending September 30, 2007 in the upper right-hand corner the chart above, Google management captured 23.5% of the $17,993 billion in combined revenues, while incurring 27.1% of the $10.758 billion in combined expenses and costs. The difference between Google's SOR and SOC was -3.567 share points. The company incurred an opportunity loss of $383.8 million. There is a high (0.9) correlation between Google's share of revenues and share of costs. Only the two green markers in this chart are above the (implicit) 90 degree line of equal proportionality. The fitted trend line is unfavorable. As Google's share of revenues doubled from 12% to 24%, it became less efficient. Note the slope of the trend line is 0.8 (with an intercept of 3.0 share points). If revenues and costs were proportional the slope would be one.
SLIDING DOWN THE ATTRACTION CURVE
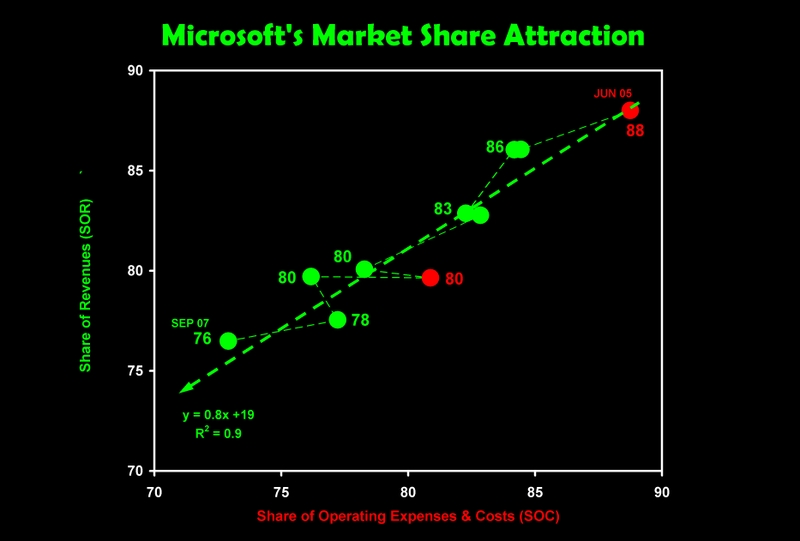
With only two companies in the analysis of market share attraction the result for Microsoft is a mirror image of that for Google. Beginning with the quarter ending June 30, 2005 in the upper right-hand corner of the following figure, Microsoft incurred $7.172 billion or 88.8% of the $8.081 billion combined operating expenses and costs of the two companies. At the same time Microsoft generated sales revenues of $10.161 billion, or 88.0% of combined revenues. As before, 0.8% may not seem line much until you realize it represents an opportunity loss of over $65 million.
Turn the clock forward ten quarters and Microsoft's share of revenues fell to 76.5% while incurring 72.9% of combined expenses. The difference between Microsoft's SOR and SOC in September 2007 was +3.567 share points which produced an opportunity gain of $383.8 million. Only the two red markers are below the (implicit) line of equal proportionality. The trend is favorable. As MSFT's share of revenues dropped it became more efficient. As before, the slope of the fitted trend is 0.8. If revenues and costs were proportional the slope would be one.
EFFICIENCY vs. PRODUCTIVITY
Over the ten quarters Microsoft became significantly more efficient: its marginal cost per (revenue share) basis point fell from $6.8 to $4.4 million. But management failed systematically to improve on its relative earnings productivity. Google on the other hand became significantly less efficient: its marginal cost per basis point increased from $0.86 to $1.62 million. At the same time Google's management improved is earnings productivity – the difference between its actual and maximum potential earnings systematically increased from a -36% to -3%.
Last year in his online discussion of my book Chris Kenton said "You can be very efficient at doing the wrong things!" The corollary is "You can be inefficient at doing the right things." Perhaps "efficiency vs. productivity" and doing the "right and wrong things" revolve around sailing in a blue ocean vs. a red ocean, at least in this case.
NOT BUYING MY PREDICTIONS
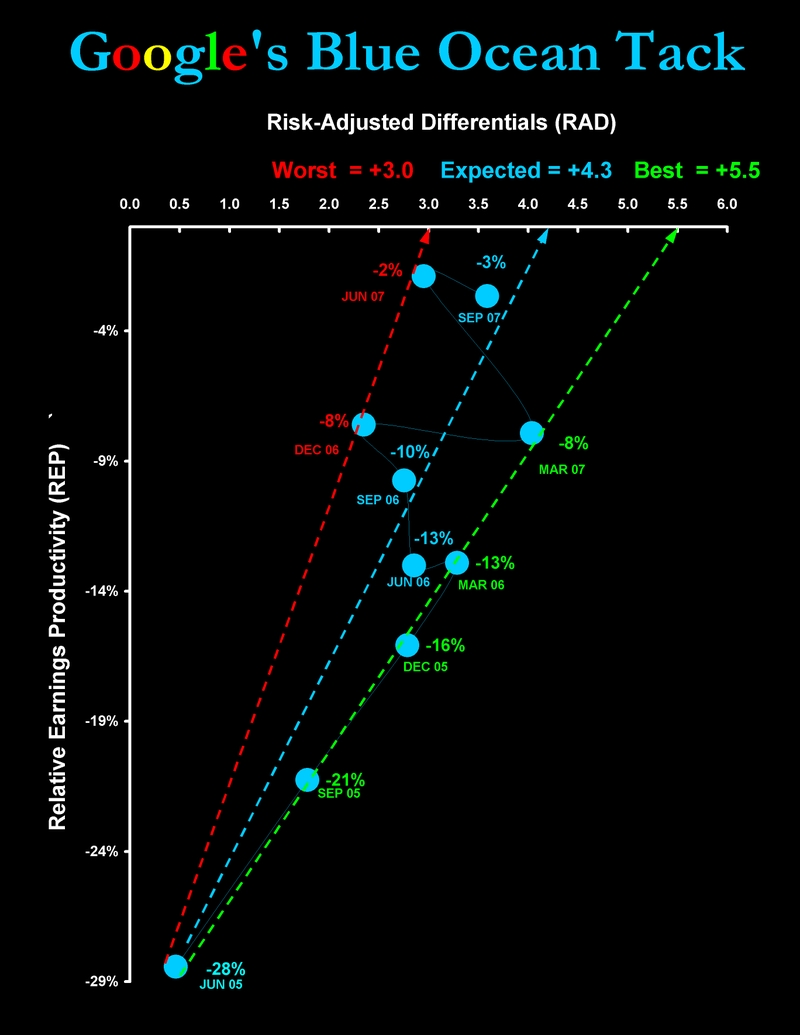
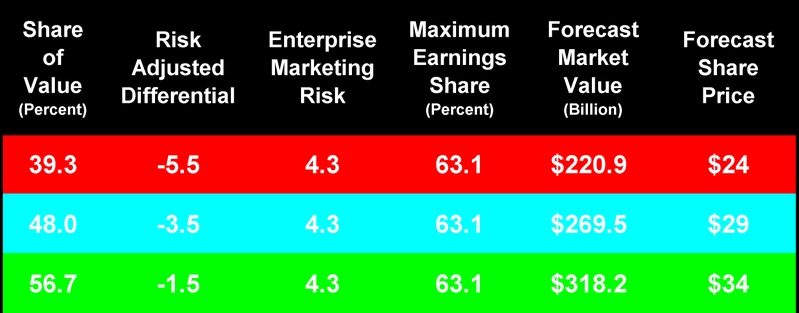
Relative earnings productivity [REP] and risk-adjusted differentials [RAD] are two inputs to the competitive stock valuation model. My post on "Google vs. Microsoft: Blue/Red Ocean Stock Pricing" published by Seeking Alpha promoted another visitor to make this comment:
I'm not buying your predictions. There are too many other factors in play here. I guess we'll see in six months but I would be surprised to see MSFT under 40 in April and GOOG over 750. Maybe your models predict it, but I just don't see it. How often does this type of model accurately predict future value?
I too would be surprised! There are indeed "other factors" in play here and they are not hidden in a black box. They are right up front:
First, the competitive stock valuation model assumes that management will maximize earnings by optimizing operating costs. Google management has satisfied this requirement. Microsoft management has not. But Google might stumble and Microsoft might get it right.
Second, the model assumes that investors believe the company will create value in excess of costs over the long run. As Professor Rappaport put it in the quote above, the company will "... maximize long run productivity" or equivalently achieve "a sustainable competitive advantage." Google investors believe management will continue to maximize long run productivity. Microsoft investors do not. But these beliefs are fragile.
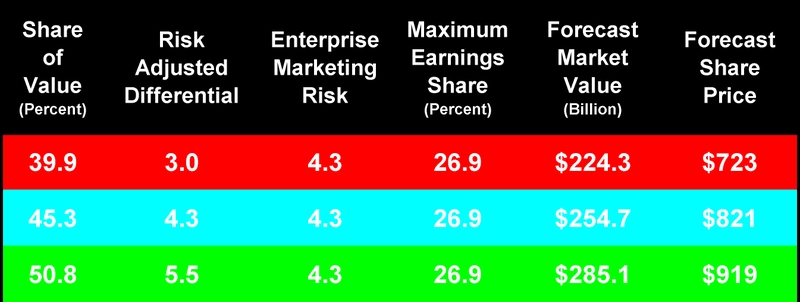
Can the results of competitive stock pricing be "safely extrapolated?" In a word, yes: but only in those cases where a company's relative earnings productivity and risk-adjusted differentials are opposite ... in the extreme. On the one hand, when REPs are nearly zero at the same time that RADs are less than -2.0 over many periods, you might take a long position in the stock. On the other hand, when you find a company's REPs are less than -100 and RADs are greater than +2.0 over many periods, you might short the stock. Both instances represent serious mispricing. In my experience these extremes are rare ... fewer than 2 in every hundred companies.
THE TAKE-AWAYS
There are two take-aways from this reply to comments. If you have the time to find the outliers, combined with the money and risk propensity to invest in them, the competitive stock valuation model might make money for you. If you are Eric Schmidt or Steve Ballmer you might find the model identifies strategic challenges you have overlooked until now. And overcoming those challenges make make money for your shareholders.
Thanks for visiting.
~V
Great finds
- Casino Italiani Non Aams
- Nuovi Siti Casino
- Casinos Not On Gamstop
- Casinos Not On Gamstop
- Casino Sites Not On Gamstop
- Casino Online Non Aams
- Casino Online Non Aams
- Casino Sites Not On Gamstop
- Best Casinos Not On Gamstop
- Sites Not On Gamstop
- Non Gamstop Casinos UK
- Best Non Gamstop Casinos
- Non Gamstop Casinos UK
- Casino Sites Not On Gamstop
- UK Casino Sites Not On Gamstop
- UK Online Casinos Not On Gamstop
- Non Gamstop Casino
- UK Online Casinos Not On Gamstop
- Sites Not On Gamstop
- Non Gamstop Casinos
- Non Gamstop Casino Sites UK
- Non Gamstop Casinos UK
- Casinos Not On Gamstop
- Casino Non Aams Sicuri
- Casino Not On Gamstop
- Casino Online
- Meilleur Casino En Ligne Français
- Nouveau Casino Belge En Ligne
- I Migliori Casino Non Aams
- Casinos En Ligne France
- Casino En Ligne France
- Paris Sportif Ufc France
- топ крипто казино
- Miglior Sito Casino Online
- Casino En Ligne Qui Paye Vraiment
- Migliori Casino Online Italia
- Site Casino En Ligne
- Meilleurs Casino En Ligne
- Tortuga Casino
- Casino En Ligne
- Casinos En Ligne
- Casino En Ligne Argent Réel
- Casino En Ligne Retrait Immédiat
- Casino En Ligne


