Google vs. Microsoft: Blue vs. Red Ocean Earnings Productivity
Google's stock price (NASDAQ: GOOG) closed on Friday October 12, 2007 at $637.39. This number brought the soothsayers out in force. In Saturdays New York Times Steve Lohr reported a sampling of views about what might bring Google's price down. Most were based on pure speculation. But one comment not only cuts to the heart of the matter, it also reminds us of the gold standard by which spending should be judged:
The biggest challenge to Google’s stock is going to be if it gets the rap of being an overspender and not rewarding shareholders fully,” said Scott Cleland, an analyst at the Precursor Group.
What's the gold standard on spending? In a word, optimize expenses. Or, spend up to the point that the cost of the last expense equals the returns to it.
Not surprisingly, Google didn't optimize its total operating expenses over the last ten quarters. However, it is a surprise to find the company actually under-spent by just over half a billion dollars in the quarter ended June 30, 2007.
This is the second in a series of posts investigating The Battle for Your Network. This one addresses another important question: are there significant differences between the earnings productivity of "Blue Ocean" compared with "Red Ocean" companies. This line of thinking, of course, was inspired by Blue Ocean Strategy, the book by Professors Kim and Mauborgne of INSEAD.
THE COST PER DOLLAR SALES
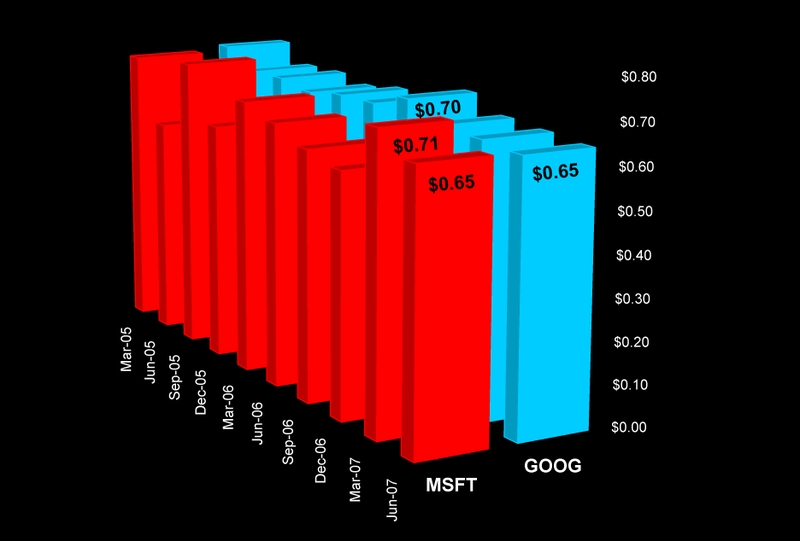
If you look at spending in the conventional way, standardized as the cost per dollar of revenues, underlying patters of over and under spending sometimes are hidden from view. This chart shows the total operating cost per dollar of revenues for Microsoft (NASDAQ: MSFT) and Google from the 1st quarter of 2005 through the 2nd quarter of 2007.
In the most recent quarter MSFT and GOOG spent the same amount to generate a dollar of sales revenue. That $0.65 includes all operating expenses: the costs of goods and services sold, plus selling and marketing expenses, research and development expenses as well as general and administrative expenses. In the previous quarter MSFT spent more ($0.71 vs. $0.66). But in September, 2006 GOOG spent more ($0.70 vs. $0.61). You can see in the chart above that their spending patterns sea-saw back and forth over the ten quarters. Somehow the "Blue Ocean" effects you might expect don't appear in these numbers. Quite so, because sometimes these effects appear only when you compare each company's optimal with its actual spending.
SPENDING'S GOLDEN RULE
Spending's golden rule is to shell out money up to the point that earnings from the last dollar after all operating expenses are greater than at any other expense level. Or, what goes out equals what comes in, at the margin.
If you apply this golden rule to Google, management actually under-spent in each of the last ten quarters. The horizontal axis in the following chart is a quarterly time series. The vertical axis is Google's total operating expense: the green schedule tracks optimal spending, the yellow one is actual spending, both in billions.

Over the ten quarters Google's pattern of under-spending decreased. In March, 2005 the difference between optimal and actual spending was $1.2 billion. By March, 2006 the difference fell to about $1.0 billion. It hovered around that level till June, 2007 when it fell to just over half a billion.
THE GOLDEN RULE AND GOOGLE'S EARNINGS
The impact of optimizing expenses is shown more dramatically by comparing Google's theoretical maximization earnings with its actual earnings before interest, taxes, depreciation and amortization [EBITDA]. This chart tracks the results. Again, quarterly time series is on the horizontal axis. But here EBITDA is on the vertical axis.

In March, 2005 the difference between Google's maximum and actual earnings was $200 million, or 32% of actual earnings. By June, 2007 that difference dropped to just $21 million, about 2% of actual. If management stays on this trajectory it looks as if over-spending will not be a problem.
RELATIVE EARNINGS PRODUCTIVITY
There's a simple way to wrap all this information up in a single metric that provides helpful guidance to investors. I call this measure Relative Earnings Productivity [REP]. Why do we need another measure of market performance? Consider what Al Rappaport says in the second edition of his classic 1986 book Creating Shareholder Value:
It is … productivity that the stock market reacts to when pricing a company’s shares. Embedded in all shares is an implied long-term forecast about a company’s productivity – that is, its ability to create value in excess of the cost of producing it. When the stock market prices a company’s shares according to a belief that the company will be able to create value over the long term, it is attributing [this belief] to the company’s long-term productivity or, equivalently, a sustainable competitive advantage. In this way, productivity is the hinge on which both competitive advantage and shareholder value hang (Rappaport 1998, 69).
Relative earnings productivity combines the concept of long-term efficiency with sustainable competitive advantage.
BLUE OCEAN vs. RED OCEAN EARNINGS PRODUCTIVITY
They say a picture is worth a thousand words. Well, for investors this chart is worth a million numbers. The quarterly time series reads across the top axis from May, 2005 through June, 2007. The vertical axis reads off relative earnings productivity.

Relative earnings productivity equals the ratio of actual to maximum earnings added to -1 (see the equation at the bottom left of this chart). Why scale REP in this odd way? In order to depict a range from zero, where actual and maximum earnings are equal, to a very large negative number where actual earnings are far less than maximum earnings. The last observation in Google's REP schedule sends a clear message to investors. In the ten quarters following its IPO, Google management systematically guided the company to the point of nearly optimizing total operating expenses by the close of the 2nd quarter of 2007.
SHOULD THIS METRIC MATTER TO INVESTORS?
It's dramatically clear that, at least in this instance, when you can catch a blue ocean competitor in the act of competing with its red ocean counterpart the difference in earnings productivity can be quite significant. The theory, developed in my book Competing for Customers and Capital, shows why relative earnings productivity is one of two key metrics in competitive stock valuation. What do you you think? Should this metric matters to investors?
~V
Great finds
- Casino Italiani Non Aams
- Nuovi Siti Casino
- Casinos Not On Gamstop
- Casinos Not On Gamstop
- Casino Sites Not On Gamstop
- Casino Online Non Aams
- Casino Online Non Aams
- Casino Sites Not On Gamstop
- Best Casinos Not On Gamstop
- Sites Not On Gamstop
- Non Gamstop Casinos UK
- Best Non Gamstop Casinos
- Non Gamstop Casinos UK
- Casino Sites Not On Gamstop
- UK Casino Sites Not On Gamstop
- UK Online Casinos Not On Gamstop
- Non Gamstop Casino
- UK Online Casinos Not On Gamstop
- Sites Not On Gamstop
- Non Gamstop Casinos
- Non Gamstop Casino Sites UK
- Non Gamstop Casinos UK
- Casinos Not On Gamstop
- Casino Non Aams Sicuri
- Casino Not On Gamstop
- Casino Online
- Meilleur Casino En Ligne Français
- Nouveau Casino Belge En Ligne
- I Migliori Casino Non Aams
- Casinos En Ligne France
- Casino En Ligne France
- Paris Sportif Ufc France
- топ крипто казино
- Miglior Sito Casino Online
- Casino En Ligne Qui Paye Vraiment
- Migliori Casino Online Italia
- Site Casino En Ligne
- Meilleurs Casino En Ligne
- Tortuga Casino
- Casino En Ligne
- Casinos En Ligne
- Casino En Ligne Argent Réel
- Casino En Ligne Retrait Immédiat
- Casino En Ligne


