Dell Inc.

January 20, 2008

Dell's Magic Marketing Machine: New Metrics You Can Use

Steve Lohr in his September 9, 2007 New York Times article “Can Michael Dell Refocus His Namesake” quoted Professor David Yoffie of the Harvard Business School:

Dell continued to do the same old thing, when it was no longer working. This is going to be about changing the way they do business at many levels.

Let’s hope Mr. Dell finds ways to do this without diminishing the power of his magic marketing machine. Chances are he won’t be able to.  His recent move into retailing suggests that Mr. Dell himself does not appreciate the degree to which that marketing machine is the source of his competitive advantage. In the same article he is quoted as saying:

A lot has changed, Mr. Dell notes, since the company tried and abruptly exited retail sales in 1994. The shift in the consumer computer market and toward notebooks, which customers want to touch before buying, is part of it. So is Dell’s need to do better in markets abroad, where people are less comfortable buying computers by phone or over the Internet. “We’re going after those new customers with retail partners,” Mr. Dell says.

He may find those new customers “… at Wal-Mart stores in the United States, at Carphone Warehouse outlets in Europe and at Bic Camera stores in Japan” but selling through these and other discount retailers surely will undermine this competitive advantage.

SOME BACKGROUND
This is the second post motivated by a December 2004 paper titled "Dell Grows Up" written by four students in the Freeman School MBA program at Tulane University. My first post in the series “If Only Michael Dell Had Listened to the Numbers” reviewed the team’s analysis of Dell (nasdqGS: DELL) in a strategic group with Hewlett-Packard (NYSE: HPQ); International Business Machines (NYSE: IBM); and Sun Microsystems Inc. (NasdaqGS: JAVAD). The team members were Michael Calabrese, Supasith “Oak” Chonglerttham, Michael Dodson and Julie Gottbrath Bruton. They recommended that Dell undertake two strategic acquisitions in order to redefine its competitive position.

The purpose of this post is to apply and compare three different ways of measuring the performance of Dell’s magic marketing machine based on -- believe it or not -- financial accounting data! You can apply these three metrics to your company:

1. Gerstner’s Rule: The Cost Per Dollar of Revenues [CPD].
2. The enterprise Market Share Attraction model [MSA].
3. My own enterprise Marketing Efficiency Ratio [MER].

Each one answers the same question from a different perspective: Relative to its competitors how efficient is an enterprise in generating sales revenues?

GERSTNER’S RULE
In Who Says Elephants Can't Dance Louis Gerstner describes the first in this set of three measures of enterprise marketing efficiency. Since he was the first one to define it I call his measure "Gerstner's Rule." Its meaning is simple: less is more. Apply this rule to any public company and you can see in a flash if the emperor has no clothes. And this metric is simple to calculate.
In Gerstner's description of the problems he faced as the new CEO of the faltering giant IBM company he said:

After months of hard work, CFO Jerry York and his team determined that IBM's expense to revenue ratio – i.e. how much expense is required to produce $1 of revenue – was wildly out of range with those of our competitors.  On average, our competitors were spending 31 cents to produce $1 of revenue, while we were spending 42 cents for the same end.  When we multiplied this inefficiency times the total revenue of the company, we discovered that we had a $7 billion expense problem! (Who Says Elephants Can't Dance, page 62-63)

He set out to solve that problem. Over the years from 1993 through 2000 he took IBM from the brink of failure to maximum earnings market share. I trace this amazing story in Chapter 6 of my book Competing for Customers and Capital. Though Gerstner didn't say exactly what "expenses" he used to calculate this ratio, my analysis leads to the conclusion he must have used the enterprise marketing expenses of IBM and its competitors. For a discussion of what these expenses include see my September 30, 2007 post Microsoft’s $154 Question: Optimizing “Red Ocean” Expenses.

COST PER DOLLAR
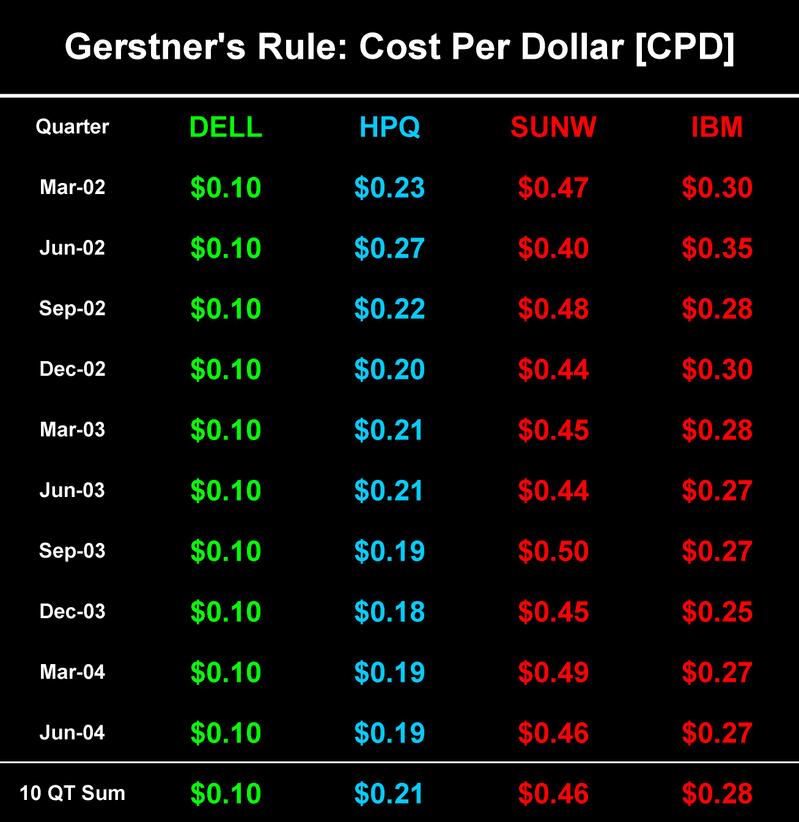
Gerstner’s rule reveals dramatically the power of Dell’s magic marketing machine in the desktop space. The following table reports the cost per dollar [CPD] for Dell, Hewlett-Packard, Sun Microsystems and IBM in each of the ten quarters beginning with March 2002. Note the date-line in this table is synchronized on the quarter ending March 2002 because two of the four players in this group file quarterly reports that corresponded with the calendar year. Dell’s reporting quarter actually ended on May 3, 2002.

Dell’s CPD averaged just $0.10 compared with $0.21, $0.46, and $0.26 for HPQ, SUNW and IBM respectively. Over the ten quarters it cost Dell less than half as much as HPQ and IBM to generate $1.00 in sales revenue. And less than one-fourth as much as it cost SUNW. This first performance measure of Dell’s magic marketing machine can be calculated on the back of an envelope.

MARKET SHARE ATTRACTION
Market share attraction [MSA] theory says that on average in a competitive market a company will attract revenues in direct proportion to its share of the expenses incurred in serving that market. The popularity of this model is based on several characteristics: it's logically consistent; it derives from four simple axioms; its parameters can easily be estimated; and it seems to outperform both linear and multiplicative models.

An interesting investigation into the properties of the [MSA] model is available in the 2001 paper "Why is Five a Crowd in the Market Share Attraction Model: The Dynamic Stability of Competition" by Paul Farris and his coauthors. Their analysis assumes that firms maximize earnings by optimizing their own spending based on competitors' last-period budgets and the MSA model.

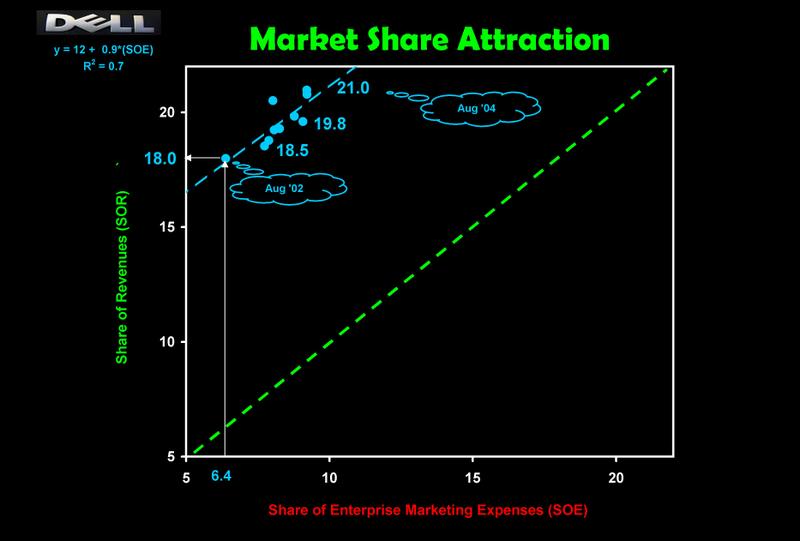
Market share attraction theory is the foundation of the second performance measure of Dell’s magic marketing machine. While it’s a bit more complicated, it’s also a lot more revealing. This scatter diagram shows Dell’s share of revenues [SOR] on the y-axis and its share of enterprise marketing expenses [SOE] on the x-axis. The same chart appeared in the team’s paper "Dell Grows Up" (Chart 4, page 9).

The dotted green diagonal line in this chart represents the long run expectation in market share attraction theory: that a company will attract revenues in direct proportion to the share of expenses incurred in serving the market. Dell knocked this expectation out of the park! In every quarter Dell’s share of revenues is more than double its share of enterprise marketing expenses. In August 2002 Dell accounted for 6.4% of the group’s expenses while generating 18.0% of group revenues. By August 2004 Dell generated 21.0% of revenues while incurring only 9.2% of enterprise marketing expenses. In all ten quarters Dell’s bang per puck was greater than two to one. Even as it share of revenues increased 300 basis points!

MARKETING EFFICIENCY RATIO
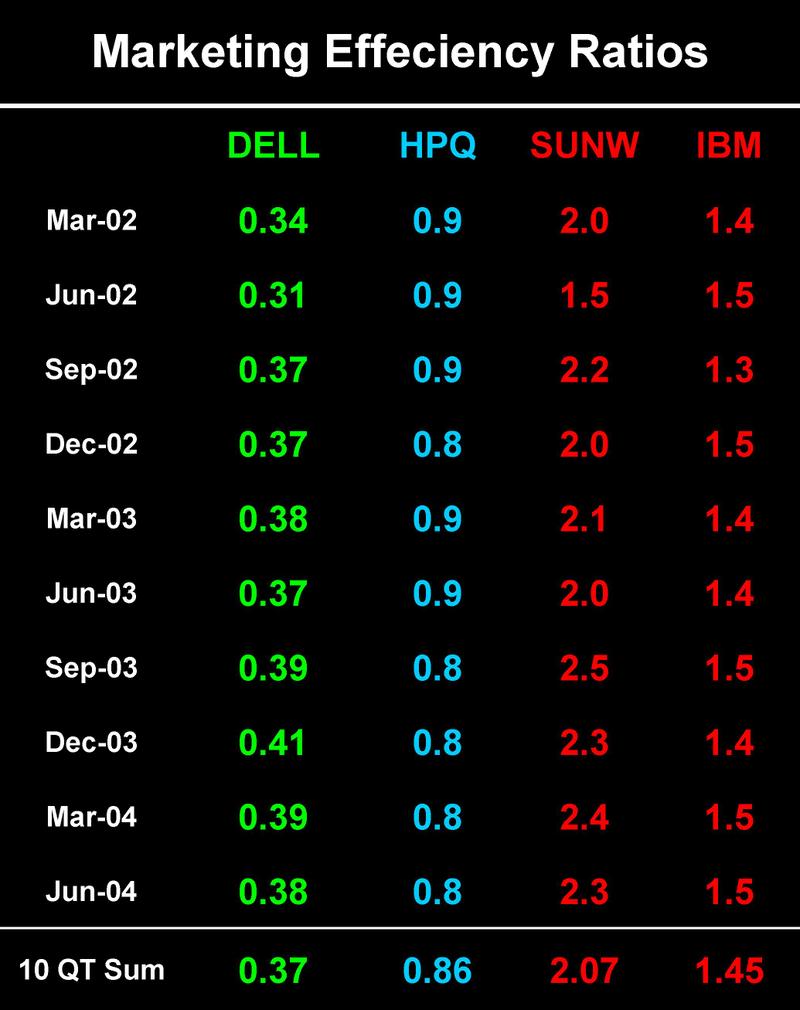
My marketing efficiency ratio [MER] is derived directly from market share attraction theory. It also is critical in the calculation of optimal enterprise marketing expenses. A company’s MER is simply its actual enterprise marketing expenses divided by its theoretical market share maintenance expenses. If actual and theoretical enterprise marketing expenses are equal, the MER is one. If actual expenses are less than theoretical expenses the MER is less than one. In this event the company is more efficient than its competitors. When actual expenses exceed theoretical expenses the company is less efficient. The following table reports marketing efficiency ratios for DELL, HPQ, SUNW and IBM.

Over the ten quarters from March 2002 through June 2004 Dell’s MER averaged 0.37 compared with 0.86, 2.07 and 1.45 for HPQ, SUNW and IBM. What does this mean? It cost Dell just 37¢ to buy enterprise marketing resources that cost the average competitor $1.00. More to the point Michael Dell and company paid just 37¢ for resources that cost HPQ 86¢; SUNW $2.07 and IBM $1.45. Clearly, the MER is the most revealing of these three measures of enterprise marketing efficiency. It’s also the most difficult to calculate.

WHICH METRIC IS THE BEST?
It’s always best to start with Gerstner’s Rule. First, it will give you a quick read on how you stack up against competitors. Second, in order to calculate CPDs you’ve got to look closely at the line items in your income statement and those of competitors that are enterprise marketing expenses. For a quick overview of these line items see my audio slide show “Enterprise Marketing Expenses.” This ensures you’re comparing apples with apples.

If you want greater precision, run the market share attraction [MSA] numbers. This requires that you calculate market share ratios on both revenues and enterprise marketing expenses. But the end result is more revealing because the MSA diagram will show if the data are real or just financial accounting noise.

Finally, if you want to optimize enterprise marketing expenses you need to run the marketing efficiency ratios. To do that you’ll need to put your hands on a copy of Competing for Customers and Capital. Then turn to Appendix A (pages 250-252) and code the equations into a spreadsheet. If you’re spending billions on enterprise marketing like Michael Dell does, it might be worth your trouble.

Thanks for visiting. Your comments are always welcome.

~V

January 13, 2008

If Only Michael Dell Had Listened to the Numbers

In the summer of 2007 Alexei Oreskovic posted an article on TheStreet.com under the title "Dell Must Get In Takeover Mode."  In that post he said that Dell (NasdaqGS: Dell) …

... has never been keen on mergers and acquisitions. But as the company strives to climb out of its doldrums, a shopping spree might be just the thing. The company formerly known as the world's No. 1 PC maker is on a mission to revive slumping sales and profit margins, with founder and CEO Michael Dell vowing to shake up everything from internal operations to its famous distribution model.

“DELL GROWS UP?”
Mr. Oreskovic's suggestion reminded me of a paper written by a team of four students in the Freeman School MBA program at Tulane University in December 2004. The team members were Michael Calabrese, Supasith “Oak” Chonglerttham, Michael Dodson and Julie Gottbrath Bruton. In their report titled "Dell Grows Up" the team outlined …

... specific steps for Dell to implement in order to maximize its EBITDA and market cap by Q2 2005. Given the dramatic changes recently announced with IBM and Lenovo forming a joint venture, Dell must act quickly to seize these opportunities and redefine its place in this evolving strategic group (Calabrese, et. al., page 1).

In addition to Dell the strategic group they analyzed included Hewlett-Packard (NYSE: HPQ); International Business Machines (NYSE: IBM); and Sun Microsystems Inc. (NasdaqGS: JAVAD). The student team recommended that Dell undertake two strategic acquisitions in order to redefine its competitive position.

One of their recommendations was to acquire Sun: "... acquisition of Sun Microsystems could translate into sales growth of US$ 3 billion (page 16)." Another recommendation was to partner with or acquire Founder Electronics:

Despite having strong ties to the Chinese government, Founder may still be open to a strategic alliance with a strong brand such as Dell to increase their slice of the Chinese PC pie.  Furthermore, Founder’s ties to the Chinese government may offer the needed political leverage for Dell’s future success in China.  ... Dell stands to realize almost US$ 3 billion in new revenue via an alliance with or acquisition of this firm (Dell Grows Up, Calabrese, et. al., page 15)."

The purpose of this post is to calculate the loss in market value suffered by Dell shareholders as a result management’s failure of capitalize on strategic acquisition opportunities available in December 2004. For background see Chapter 6 "The Battle for Your Desktop" in my book Competing for Customers and Capital.

FORMERLY KNOWN AS THE WORLD'S # 1
In the quarter ended May 2002 Dell’s revenues were just over $8.1 billion. Its stock closed at $24.36 and its market cap was $68.3 billion. In the quarter ended April 2002, the last one before the merger with Compaq kicked in, Hewlett-Packard’s revenues were a shade over $10.6 billion. Its stock closed at $17.10. Its market cap was $33.8 billion. Just under half of Dell’s.

Now roll the clock forward to Friday January 11, 2008. On that day Dell’s stock closed at $20.70. Its market cap was $46.5 billion. HPQ’s stock closed at $45.00 and its market cap was $155.8 billion. Put another way, five years later HPQ was worth more than three times Dell. What caused this reversal of fortunes? The answer is simple: Carly Fiorina took the bold strategic decision to acquire Compaq. Though subsequently she was fired for her foresight by a dysfunctional board, the success of her decision was clear even before she left HPQ. If you’re interested in the true but untold story of her extraordinary performance at the helm of HP take a look at my May 19, 2007 post “Carly Delivered While Investors Fiddled.” Over the same period Michael Dell tried to grow his revenues organically by sticking with his worn out business model.

THE LIMITS OF DELL’S BUSINESS MODEL
The limits of Dell’s business model were apparent even in early 2002. Remember Dell's business model? It's was "selling computer systems directly to consumers" which "eliminates retailers that add unnecessary time and cost."  Well and good for its time. But, this model does not fit either the Asian or European consumer market and it was not designed for the corporate desktop customer in any market. When I wrote the first draft of Chapter 6 it was clear to me that:

Dell needed to find a way to duplicate its marketing efficiency with the corporate buyer.  To serve this segment Dell needed either to develop its own direct sales force or negotiate a change in the purchasing behavior of corporate customers.  Both of these options take time and changing the purchasing behavior of customers with high switching costs is a complex and costly process.

To motivate corporate buyers to switch to Dell required significant investments by the customer to change order and billing practices. This required design and installation of new accounting and control systems to manage end user buying decisions (Competing for Customers and Capital, pages158-59).

Even as the calendar is off and running into the New Year Michael Dell has yet to bridge the gap between his old domestic-direct-to-consumer model and the new international-integrated-business model he needs. Dell’s greatest strength historically – its direct to consumer business model – has become its greatest weakness.

In a moment I will go on to describe the drag on revenues and earnings caused by this business model of limited view. For now let's look briefly at the metrics required to document its impact on sales revenue, earnings and market value.

OPTIMAL SHARE AND ENTERPRISE MARKETING
A company's "optimal" market share and sales revenue occur when the earnings from the last sales dollar are just equal to the cost of producing it. The relevant costs are what I call "enterprise marketing expenses."

There's a huge difference between the costs of "narrow marketing" and "enterprise marketing." Narrow marketing is advertising and promotion expenses. Enterprise marketing is much, much more. To begin with it includes selling, general and administrative (SG&A) expenses.  SG&A expenses capture advertising and promotion, of course, but also salaried employee expenses, including sales force expenses. In addition, enterprise marketing includes R&D expenses.

In short, enterprise marketing includes almost all the expenses that influence the customer experience. In marketing-speak, this is where the money behind every customer touch-point gets counted. Whether it’s the cost of designing a new keyboard, of a promotion snuck in with an invoice, of multiple phone conversations with a customer service rep, of the lead story in DealBook or MarketWatch covering something the CEO did or said, or the cost of designing a completely new product, they all are counted in Dell’s enterprise marketing expenses. If you want to dig into the details on this topic you’re welcome to review my audio slide show "Enterprise Marketing Expenses."

DELL’S LOST EARNINGS
The following chart shows Dell's actual earnings compared with its maximum earnings as reported by the Freeman School student team in Dell Grows Up (Chart 2,page 8). Maximum earnings occur when a company optimizes spending on enterprise marketing.

This chart covers the period beginning with the 2nd quarter 2002 through the 3rd quarter 2004. Note, the date-line is synchronized on the quarter ending March 2002 because two of the four players in this group file quarterly reports that corresponded with the calendar year. Dell’s reporting quarter actually ended on May 3, 2002.

In early 2002 Dell’s actual earnings ($590 million) fell short of maximum earnings ($709 million) by $119 million. By June 2004 the short fall increased to $267 million. Over these ten quarters Dell left just under $2.5 billion in earnings on the table by under-investing in market opportunities keenly apparent even to students in December 2004.

DELL’S EXTRAORDINARY UNDER-SPENDING
The next chart documents Dell’s extraordinary under-spending on enterprise marketing. In early 2002 it was clear that Dell faced an uphill battle with its own culture by trying to grow organically.

Dell_actual_vs_optimal_eme

In the second calendar quarter, Dell actually spent $801 million on enterprise marketing. In order to capitalize on the opportunities driven by its off-the-scale enterprise marketing efficiency and the rebirth of the PC market Dell should have spent nearly $1,484 million on enterprise marketing. That was an 85% short-fall from optimal expenses. In every one of the following nine quarters the short-fall between actual and optimal spending exceeded 100%. Cumulatively over the ten quarters Dell under-spent by some $11 billion. As a result, the difference between the company’s actual sales revenue ($11.7 billion) and its optimal sales revenue ($19.7 billion) in mid-year 2004 was $8.0 billion USD.

DELL’S EIGHT BILLION DOLLAR CHALLENGE
The differences between Dell’s actual and optimal revenues of $8.0 billion cannot possibly be achieved without a major change in its scale of operations. The only way to achieve such a change of scale in a single year is through acquisition. The MBA team recognized this challenge and outlined a strategy to meet it:

Realization of a revenue increase of this magnitude in this relatively short timeframe will require Dell to look beyond organic growth and incremental increases in current spending. In the United State, the landscape for acquisition is decidedly limited. However, Sun Microsystems does present an attractive possibility especially in the light of their seeming undervaluation and recent management woes. Acquisition of SUNW could offer Dell a host of capabilities to better compete in the domestic B2B market, specifically with regard to the back office. Sun’s proven innovation, market longevity, and brand could offer Dell greater credibility with enterprise clients. There exist some cultural barriers to a seamless assimilation of these two companies, chiefly Sun’s aversion to the Wintel platform in favor of proprietary hardware and software architectures. Sun would bring to the table greater gross margins and its $1.4 billion quarterly investments in [enterprise marketing] (Dell Grows Up, Calabrese, et. al., page 14).

That $1.4 billion would have closed the gap between Dell’s actual and optimal enterprise marketing expenses. The comment about Sun’s preference for proprietary solutions is particularly prescient, given its newly minted open-standards strategy led by the give-away of its vaunted Solaris Operating System. But there’s still more to chew on in that MBA student report:

A domestic growth focus is not sufficient to aid Dell in capturing the firm’s potential sales revenue growth. While Dell is currently focusing primarily on B2C customers in Europe, opportunities exist for a B2B push. In order to facilitate this expansion, Dell must once again look outside the firm for potential partners or acquisitions. This time, however, the target or targets should be in the IT services or business consulting arena. … Moving eastward from Europe, the most obvious target for international growth for Dell is China (Dell Grows Up, Calabrese, et. al., page 14)..

CLOSING DELL’S REVENUE GAP
Acquiring Sun Microsystems revenues on top of Founder Electronics would have brought Dell within a stone’s throw of the $20 billion revenue target envisioned by my MBA students in their December 2004 report. In June 2004 Dell’s stock closed at $35.47 giving the company a market value of $89.3 billion. At that time valued more than HPQ ($61.3) and SUNW ($15.6) combined. If Dell had followed the course of acquisitions recommended by the students, in June of 2005 the company’s stock most likely would have closed at just north of $76 a share creating a market cap of $192 billion. That number is almost four times Dell’s market cap as of last Friday, not counting the potential appreciation in its stock price in the ensuing two and a half years.

This is just one of the many stories packed with strategic insights that can be told by analyzing the competition for customers and capital. If only Michael Dell had listened to the numbers.

Thank you for visiting. As always your comments are welcome.

~V

p.s. Wishing you a happy and prosperous 2008!