Microsoft + DoubleClick?
THE BUZZ
The wires were abuzz last week with the Wall Street Journal report that Google had joined Microsoft in the race to buy DoubleClick. We know that DoubleClick is majority-owned by San Francisco private-equity firm Hellman & Friedman and they have hired Morgan Stanley to find a buyer for it at $2 billion. We also know from the Journal's report that Time Warner's AOL unit and Newscorp are customers of DoubleClick. Yahoo! also has talked acquisition with the company.
AN INSIDE VIEW
You can be sure that senior managers of all these companies, as well as their board members and investment bankers are discussing the pros and cons as well as running the numbers on DoubleClick right now.
I wondered if this acquisition was in Microsoft's best interests, so I went searching for DoubleClick's 2006 revenues and found Don Dodge's web log. Don is currently Director of Business Development for Microsoft's Emerging Business Team. Here's what he thinks about the acquisition:
DoubleClick could be a good strategic fit for Microsoft's AdCenter and online business. At some price it makes sense. The numbers have to work. Heck, Microsoft can even overpay a little and make it work in the long run. But, at $2 billion...I would pass.
AN OUTSIDE VIEW
But Larry Dignan, Executive Editor of ZDNet news and blogs thinks the acquisition is a good idea:
It's unclear whether Microsoft would pull the trigger on a big deal, but it may add up. Consider the options for Microsoft. It could buy Yahoo in an expensive deal. It could continue to invest in online services that aren't getting traction. Or it could take the middle ground, which would be acquiring DoubleClick.
Given these conflicting views, I decided to run some basic enterprise marketing numbers on the three main players in this game: Microsoft, Google and Yahoo! The results are surprising.
TWO MARKETS
In the enterprise marketing framework two markets are always in play: the markets for customers and capital. And we know they interact. Increased revenues feed back on market valuation with the promise of increased cash flow. And higher market valuations feed back on revenues by providing cash for aquisitions.

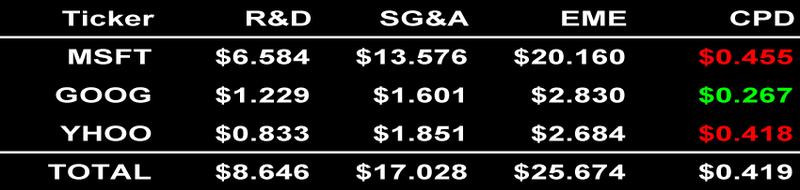
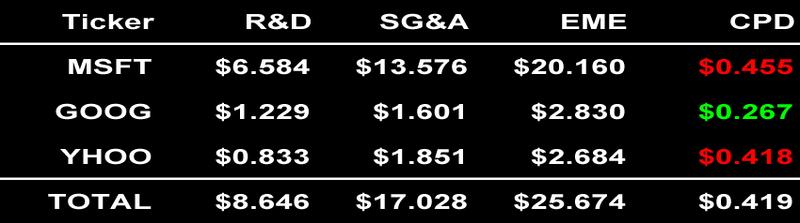
This table shows the un-level playing field for the three companies and the group totals. Using the 2006 data in Yahoo! Finance the companies generated a total of $61.3 billion in revenues and created $469.5 billion in market value. This led to a value/revenue (v/r) ratio of 7.66 for the three combined. Overall they created $7.66 in market value for every dollar of sales revenue.
THE VALUE/REVENUE RATIO
In my study of The Value/Revenue Ratio of all public firms from 1950 through 2005 I found the average to be 1.1 which means in the long-run revenues and market cap are about equal. The standard deviation in the v/r ratio increased systematically from 1.2 in the decade of the 1950s to over 70 in the volatile period from 2000 to 2005. In the the1991-1999 sample of 50,472 firms the standard deviation in the v/r ratio was 7.92. So the combined performance of this Internet group in 2006 was rather modest.
STUCK IN A RUT?
Notice in the table above that Microsoft generated only $6.31 in value for each dollar of sales, while Google generated $13.83 in market value for every dollar of sales. Microsoft's value/revenue ratio is just like another major player in software and servers: in 2006 Oracle's was 6.97. The gaming segment accounted for about 10% of Microsoft's revenues. Nintendo, a stand alone competitor with similar gaming revenues, had a v/r ratio of 4.50 in 2006. Is Microsoft stuck a rut they want to get out of? If so, DoubleClick might be part of the solution.
GERSTNER'S RULE
The first thing we need to know in order to understand what's driving these results is the enterprise marketing efficiency for each player. Lou Gerstner, in his book Who Says Elephants Can't Dance?, laid out a rule of thumb on enterprise marketing efficiency. It's simple and revealing: how much does it cost to generate a dollar in sales revenue compared with your competitors? This is Gerstner's cost per dollar (CPD) rule. It's one of two measures of enterprise marketing efficiency I use in my analysis of The Battle for Your Desktop.
REDMOND, YOU HAVE A PROBLEM
Enterprise Marketing Expenses (EME) are all the costs of the people and programs that influence how customers and investors think, act and feel about a company.
In 2006 Microsoft spent $6.584 billion on R&D, plus an additional $13.576 billion on Selling, General and Administrative expenses. So, the company's total bill for enterprise marketing came to $20.160 billion. It cost Microsoft 45.5¢ to generate one dollar in sales in 2006.
Google spent $1.229 billion on R&D, plus another $1.601 billion on Selling, General and Administrative expenses for a total enterprise marketing expenditure of $2.830 billion. So, Google's CPD was just 26.7¢.
THE PUNCH LINE
It cost Microsoft 18.8¢ more to generate a dollar in sales than it cost Google. Multiply that 18.8¢ times its sales revenues and you find that Microsoft has an $8.3 billion dollar problem. That's how much the company was over-spending on enterprise marketing in 2006 compared with Google. At the beginning of this post I said increased revenues feed back on market valuation with the promise of increased cash flow. And higher market valuations feed back on revenues by providing cash for acquisitions. Can Microsoft's overspending problem be solved by the acquisition of DoubleClick? What do you think?
Great finds
- Casino Italiani Non Aams
- Nuovi Siti Casino
- Casinos Not On Gamstop
- Casinos Not On Gamstop
- Casino Sites Not On Gamstop
- Casino Online Non Aams
- Casino Online Non Aams
- Casino Sites Not On Gamstop
- Best Casinos Not On Gamstop
- Sites Not On Gamstop
- Non Gamstop Casinos UK
- Best Non Gamstop Casinos
- Non Gamstop Casinos UK
- Casino Sites Not On Gamstop
- UK Casino Sites Not On Gamstop
- UK Online Casinos Not On Gamstop
- Non Gamstop Casino
- UK Online Casinos Not On Gamstop
- Sites Not On Gamstop
- Non Gamstop Casinos
- Non Gamstop Casino Sites UK
- Non Gamstop Casinos UK
- Casinos Not On Gamstop
- Casino Non Aams Sicuri
- Casino Not On Gamstop
- Casino Online
- Meilleur Casino En Ligne Français
- Nouveau Casino Belge En Ligne
- I Migliori Casino Non Aams
- Casinos En Ligne France
- Casino En Ligne France
- Paris Sportif Ufc France
- топ крипто казино
- Miglior Sito Casino Online
- Casino En Ligne Qui Paye Vraiment
- Migliori Casino Online Italia
- Site Casino En Ligne
- Meilleurs Casino En Ligne
- Tortuga Casino
- Casino En Ligne
- Casinos En Ligne
- Casino En Ligne Argent Réel
- Casino En Ligne Retrait Immédiat
- Casino En Ligne

